 图表作文例文.docx
- 文档编号:5483521
- 上传时间:2022-12-17
- 格式:DOCX
- 页数:5
- 大小:167.05KB
图表作文例文.docx
《图表作文例文.docx》由会员分享,可在线阅读,更多相关《图表作文例文.docx(5页珍藏版)》请在冰豆网上搜索。
图表作文例文
表格型图表作文
Directions:
Forthispart,youareallowed30minutestowriteacompositiononthetopicHowPeopleSpendTheirHolidays.Youshouldwriteatleast120words,andbaseyourcompositiononthetableandtheoutlinegivenbelow:
year
1990
1995
2000
Traveling
37%
51%
76%
Stayingathome
63%
49%
24%
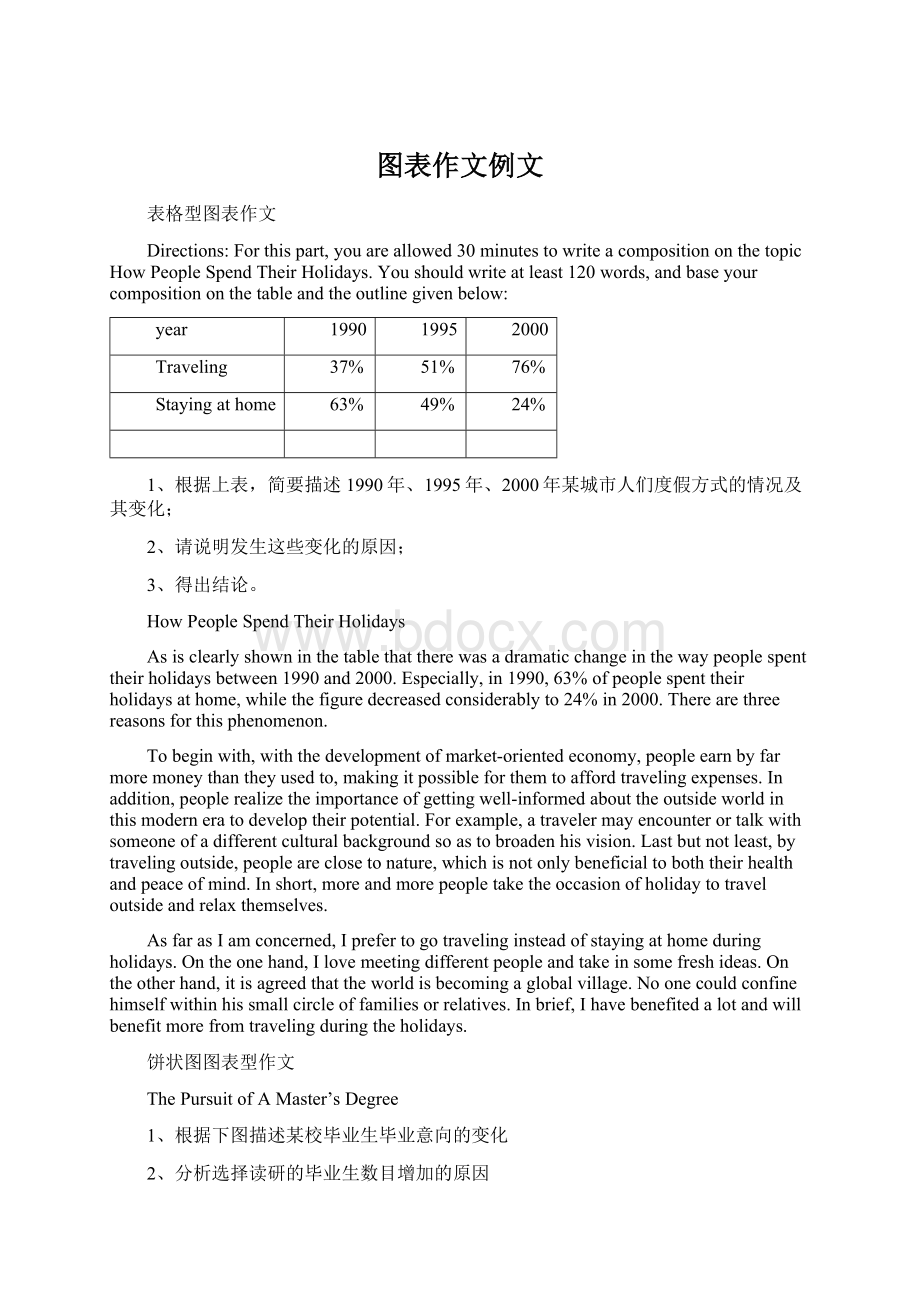
1、根据上表,简要描述1990年、1995年、2000年某城市人们度假方式的情况及其变化;
2、请说明发生这些变化的原因;
3、得出结论。
HowPeopleSpendTheirHolidays
Asisclearlyshowninthetablethattherewasadramaticchangeinthewaypeoplespenttheirholidaysbetween1990and2000.Especially,in1990,63%ofpeoplespenttheirholidaysathome,whilethefiguredecreasedconsiderablyto24%in2000.Therearethreereasonsforthisphenomenon.
Tobeginwith,withthedevelopmentofmarket-orientedeconomy,peopleearnbyfarmoremoneythantheyusedto,makingitpossibleforthemtoaffordtravelingexpenses.Inaddition,peoplerealizetheimportanceofgettingwell-informedabouttheoutsideworldinthismoderneratodeveloptheirpotential.Forexample,atravelermayencounterortalkwithsomeoneofadifferentculturalbackgroundsoastobroadenhisvision.Lastbutnotleast,bytravelingoutside,peopleareclosetonature,whichisnotonlybeneficialtoboththeirhealthandpeaceofmind.Inshort,moreandmorepeopletaketheoccasionofholidaytotraveloutsideandrelaxthemselves.
AsfarasIamconcerned,Iprefertogotravelinginsteadofstayingathomeduringholidays.Ontheonehand,Ilovemeetingdifferentpeopleandtakeinsomefreshideas.Ontheotherhand,itisagreedthattheworldisbecomingaglobalvillage.Noonecouldconfinehimselfwithinhissmallcircleoffamiliesorrelatives.Inbrief,Ihavebenefitedalotandwillbenefitmorefromtravelingduringtheholidays.
饼状图图表型作文
ThePursuitofAMaster’sDegree
1、根据下图描述某校毕业生毕业意向的变化
2、分析选择读研的毕业生数目增加的原因
3、说明选择读研对个人和社会产生的影响
Itisillustratedinthepiechartsthatgraduates’choicesaftergraduationhaveexperiencedmuchchange.Thenumberofstudentschoosingtopursueamaster’sdegreeandstudyabroadgrowsseveraltimesoverthedecade.
Thereasonsoftheincreasingnumberofstudentspursuingamaster’sdegreeareasfollows.First,withthenumberofcollegegraduatesgrowingeachyear,thesituationinthejobmarketisgettingmuchmoreserious.Thepublicawarenessofthesituationhascreatedasurgeofinterestinseekingamaster’sdegree.Secondly,manycross-nationalcompaniessetamuchhigherstandardfornewrecruitsthanever.Itseemsthatthehighereducationyouhave,thehighersalaryyoumayreceive.
Choosingtostudyformaster’sdegreewillbenefittheindividualsandthewholesocietyaswell.ThequalityofChineseintellectualswillbeconsiderablyenhanced,whichinturnwillboosttheprogressofthewholesociety.
柱状图:
Direction:
Forthispartyouareallowed30minutestowriteacompositiononthetopic:
CellPhones.Youshouldwritenolessthan120wordsandbaseyourcompositionontheoutlinebelow:
1.描述上图所示的手机用户数的变化情况
2.出现这种情况的原因
3.对此现象作出评价
CellPhones
Asisshowninthechart,cellphonesarebecomingincreasinglypopularwithinChina.In1999,thenumberofcellphonesinusewasonly2million,butin2002,thenumberreaches5million.Andintheyear2005,thenumberhassuddenlysoaredto9million.
Therearemanyfactorscontributingtothisdevelopment.Firstly,acellphonehasnowiresandcanbecarriedeverywhereeasily.Secondly,acellphoneissomethingwonderfulthatwecanhavefunwithnews,games,musicandchatthroughsendingshortmessages.Thirdly,thedropinpriceandthesimultaneousimprovementinthefunctionshavemadeitpossibleforanaveragepersontomakeuseofcellphone.
Thewideuseofcellphoneshasmadethemmoreandmoreindispensableinpeople’sdailylife.Themanyfunctionsofthecellphonehavemadecertainpeoplereluctanttoseparatethemselvesfromtheircellphone.
折线图:
Directions:
Forthispart,youareallowed30minutestowriteashortessayentitledBlog.Youshouldwriteatleast120wordsbasedonthechartandoutlinegivenbelow:
下图是2007年1-10月中国博客服务人均月度有效浏览时间及增长率,描述变化,说明原因。
Blog
Thishistogram(柱状图;直方图)showsthenumberofpeopleusingblogservicesfromJanuarytoOctoberin2007.FromitwecanseethatthenumberofusersincreasedmonthlyfromJanuarytoAugust,exceptFebruary.Aftertwopeakmonths,JulyandAugust,thenumberdroppedslightlyinSeptember,whileinOctoberitpickedupagain.
Possiblereasonsforthesechangesarefirst,inFebruaryChinesepeoplecelebratedthemostimportantfestival——ChineseNewYear.Thismeansmorepeoplespentmoretimewiththeirfamiliesandfriends,andthereforetheydidn’thaveasmuchtimeforsurfingonline.Secondly,collegestudentsarethemainusersofblogservices.WhileinJulyandAugust,theyhadsummerholidays,whichenabledthemtohavemoresparetimereadingandwritingblogs.Thirdly,withimprovementsofblogservicesandtheinfluenceofsome“starbloggers”,mostofwhomarecelebrities,blogsarebecominganimportantwayforpeopletoexpressthemselvesandcommunicatewithothers.Somoreandmorepeoplearestartingtousetheseservices,whichhelpexplaintheoverallincreaseshownhere.
表格
Forthispart,youarerequiredtowriteacompositionabout120wordsonthetopic:
ChangesinPeople’sDailyExpenses.YourcompositionshouldbewrittenonthefollowingtableandChinesegivenbelow.
1.描述图表中人们每天开支变化情况
2.请说明发生这些变化的原因
3.结合图表对未来作出合理的预测
ChangesinPeople’sDailyExpenses.
Whatisshowninthetableaboveindicatesthatdramaticchangeshavetakenplaceinthepeople’sdailyexpensesfrom1995to1999.Theexpensesonfoodhavedeclinedby30%whilethoseonclothingandrecreationhaveincreasedrespectivelyby9%and7%.Thestatisticsofriseandfallseemtoexistinisolationbutcloselyrelatedtooneanother.
Therearetwofactorsaccountingforthesechanges.Developmentineconomyisanessentialoneinthefiveyears.Theincreasedincomeresultingfromeconomicgrowthplaysanimportantpartinthelessexpenseonfood.Hence,asmallpercentageoftotalincomeisenoughtocoverfoodexpense.Anotheroneisthechangesinlifestyle.Whenfoodpresentsnoworrytotheaverage,peoplebegintofocusmoreofinterestonhandsomeappearanceandhappyleisuretime.Asaresultofsuchashift,spendingonclothingandrecreationincreasesyearafteryear.
Fromtheanalysesmadeabove,wemaycometotheconclusionthatpeople’slivingstandardshavebeenconstantlyimprovedbetween1995and1999.Withthefurthergrowthineconomyandmorechangesinlifestyle,thetendencyindicatedinthetablewillcontinueinthebetterdirection.


- 配套讲稿:
如PPT文件的首页显示word图标,表示该PPT已包含配套word讲稿。双击word图标可打开word文档。
- 特殊限制:
部分文档作品中含有的国旗、国徽等图片,仅作为作品整体效果示例展示,禁止商用。设计者仅对作品中独创性部分享有著作权。
- 关 键 词:
- 图表 作文 例文
 冰豆网所有资源均是用户自行上传分享,仅供网友学习交流,未经上传用户书面授权,请勿作他用。
 转基因粮食的危害资料摘编Word下载.docx
-
高中英语词组大全Word文档下载推荐.docx
-
卫计局年工作总结及新年工作计划Word格式.docx
-
贵州省煤矿安全管理人员安全资格证A考试概况Word格式.docx
-
系统集成项目招标文件Word文件下载.docx
-
消防设计技术审查的要点Word文档格式.docx
-
第三章 习题课 带电粒子在磁场或复合场中的运动Word格式.docx
-
湖南岳阳中考英语模拟卷含答案Word文档格式.docx
-
电子商务考试题总汇打印版打印打印Word下载.docx
-
选调生考试备考言语理解与表达真题Word文档格式.docx
-
高考物理实验题专练 专练15Word文档格式.docx
-
加装奥迪A4L蓝牙电话功能Word文档下载推荐.docx
-
学年下学期好教育高三月考仿真卷A卷 语文 学生版后附详解Word文档下载推荐.docx
-
净化生产车间工程一般施工技术施工方案Word文档格式.docx
-
内蒙古呼和浩特市第六中学学年高一政治下学期期末考试试题Word下载.docx
-
证券行业客户经理电话营销技巧与实例Word文档下载推荐.docx
-
叶芝 苇间风文档格式.docx
-
最新中美贸易摩擦的原因及解决对策1论文Word文件下载.docx
-
意义的近义词Word格式文档下载.docx
-
上海市中考英语试题S.docx
-
专题12观点论证类设问.docx
-
附加安心重疾条款.docx
-
设计变更管理办法修改意见稿FINAL汇编.docx
-
毕业赠言毕业致词精选多篇.docx
-
银行新员工代表发言稿精选多篇.docx
-
北京市朝阳区届高三第一学期期末语文试题Word版含答案.docx
-
HL线切割使用说明书模板.docx
-
车工实训周记.docx
-
USBHID键盘扫描码.docx
-
Apmpoqu4调研报告.docx
-
最熟悉的陌生人作文八篇.docx
-
被动语态综合讲解.docx
-
强制检定计量器具表.docx
-
亲子活动方案四篇实用.docx
-
轻钢结构阳光棚施工方案.docx
-
秋天来了作文二年级.docx
-
全国单证员基础理论与知识试题.docx
-
全国招标师考试真题与答案科目齐全.docx
-
让我感动的一个人作文15篇.docx
-
人工智能与健康试题及答案.docx
-
人教版九年级全一册英语单词表.docx
-
人教版四年级语文下册期末质量检测卷2套.docx
-
人教版小学语文二年级下册第六单元.docx
-
人教课标版小学语文六年级下册知识点梳理解读.docx
-
人力资源状况分析报告之欧阳科创编.docx
-
亲人让我心绝望的说说.docx
-
青少年心理发展特点与教育.docx
-
秋季学期高一8班第一次月考语文考试试题1.docx
-
全国出版专业技术人员职业资格考试中级基础真题答案.docx
-
全国统计从业资格考试《统计法基础知识》考试重点.docx
-
燃气规范施工.docx
