 精品最新来自国外的房地产投资财务评估的第手资料.docx
- 文档编号:5287503
- 上传时间:2022-12-14
- 格式:DOCX
- 页数:43
- 大小:45.86KB
精品最新来自国外的房地产投资财务评估的第手资料.docx
《精品最新来自国外的房地产投资财务评估的第手资料.docx》由会员分享,可在线阅读,更多相关《精品最新来自国外的房地产投资财务评估的第手资料.docx(43页珍藏版)》请在冰豆网上搜索。
精品最新来自国外的房地产投资财务评估的第手资料
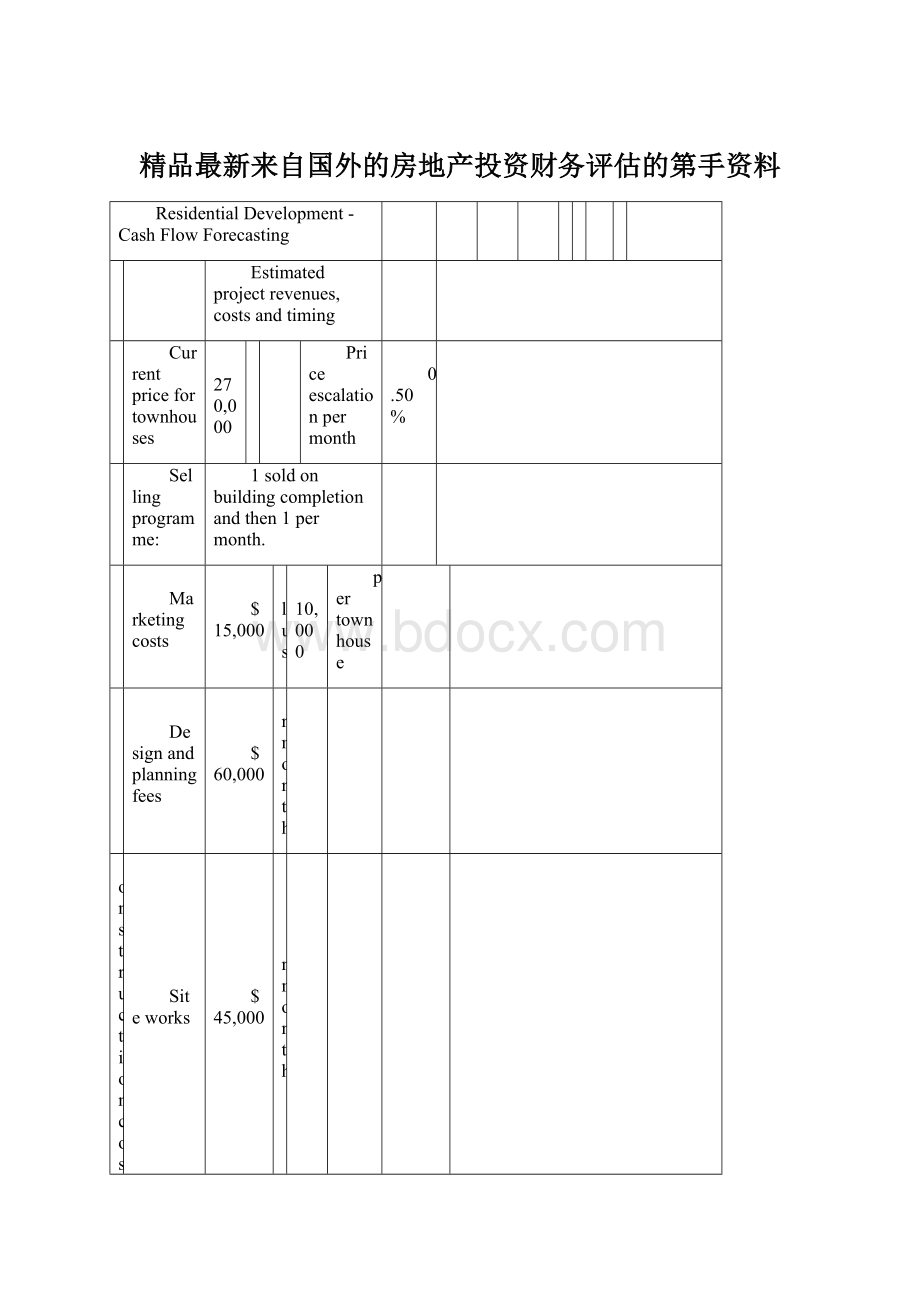
ResidentialDevelopment-CashFlowForecasting
Estimatedprojectrevenues,costsandtiming
Currentpricefortownhouses
$270,000
Priceescalationpermonth
0.50%
Sellingprogramme:
1soldonbuildingcompletionandthen1permonth.
Marketingcosts
$15,000
plus
$10,000
pertownhouse
Designandplanningfees
$60,000
inmonth
2
Constructioncosts
Siteworks
$45,000
inmonth
3
Building
$625,000
paidin4stages,2monthlyfrommonth4.
Buildingcontractpermitscontractortorecoverincreasesinmaterialpricesandwagesduringconstruction.
Estimatedmonthlyrateofinflationinbuildingcosts
0.25%
permonth
Landscaping
$32,000
inmonth
10
Purchaseofsite
$225,000
pluscostsof
4.00%
Resultingmonthlyprojectcashflows[1]
Month
EOM0
EOM1
EOM2
EOM3
EOM4
EOM5
EOM6
EOM7
EOM8
EOM9
EOM10
EOM11
EOM12
EOM13
EOM14
Salesoftownhouses
$283,500
$284,850
$286,200
$287,550
$288,900
Costsofsale
[2]
($25,000)
($10,000)
($10,000)
($10,000)
($10,000)
Landplusbuyingcosts
($234,000)
Designfees
($60,000)
Siteworks
($45,338)
Buildingcosts
($157,813)
($158,594)
($159,375)
($160,156)
Landscaping
($32,800)
Projectcashflowsbeforetax
($234,000)
$0
($60,000)
($45,338)
($157,813)
$0
($158,594)
$0
($159,375)
$0
$65,544
$274,850
$276,200
$277,550
$278,900
RESULTS
Netpresentvalueatamonthlyrateof
4%
$16,607
Internalrateofreturn
4.27%
permonth
51.28%perannum
Workbook6.3:
DemonstratingMultipleIRRsWithinOneSetofCashFlows.
ProjectDataandCalculations.
EOY0
EOY1
EOY2
CashFlows
-190
455
-270
CalculatedIRR=
8.49%
CalculatedNPV=
$1.37
DataTableofNPVsatVariousRatesofReturn
ReqdRate
14.00%
Rate
NPV
0.00%
-$5.00
1.00%
-$4.18
2.00%
-$3.44
3.00%
-$2.75
4.00%
-$2.13
5.00%
-$1.56
6.00%
-$1.05
7.00%
-$0.59
8.00%
-$0.19
9.00%
$0.18
10.00%
$0.50
11.00%
$0.77
12.00%
$1.01
13.00%
$1.21
14.00%
$1.37
15.00%
$1.49
16.00%
$1.59
17.00%
$1.65
18.00%
$1.68
19.00%
$1.69
20.00%
$1.67
21.00%
$1.62
22.00%
$1.55
23.00%
$1.45
24.00%
$1.34
25.00%
$1.20
26.00%
$1.04
27.00%
$0.87
28.00%
$0.67
29.00%
$0.46
30.00%
$0.24
31.00%
-$0.01
32.00%
-$0.26
33.00%
-$0.53
34.00%
-$0.82
35.00%
-$1.11
Workbook6.4:
DemonstratingNoIRRSolutionWithinOneSetofCashFlows.
ShowingthatValidNPVSolutionExists,evenwhenIRRcannotbeComputed.
ProjectDataandComputations
EOY0
EOY1
EOY2
CashFlows
-210
455
-270
CalculatedIRR=
#NUM!
CalculatedNPV=
-$18.63
RequiredRate
14.00%
DataTableofNPVsatVariousRatesofReturn
Rate
NPV
0.00%
-$18.63
1.00%
-$24.18
2.00%
-$23.44
3.00%
-$22.75
4.00%
-$22.13
5.00%
-$21.56
6.00%
-$21.05
7.00%
-$20.59
8.00%
-$20.19
9.00%
-$19.82
10.00%
-$19.50
11.00%
-$19.23
12.00%
-$18.99
13.00%
-$18.79
14.00%
-$18.63
15.00%
-$18.51
16.00%
-$18.41
17.00%
-$18.35
18.00%
-$18.32
19.00%
-$18.31
20.00%
-$18.33
Workbook6.5:
DemonstratingConflictBetweenIRRandNPVinMutuallyExclusiveInvestments.
WithPlotofNPVProfiles
PROJECTA
EOY0
EOY1
EOY2
CashFlows
-2000
200
3700
CalculatedIRR=
41.11%
RequiredRate
9.00%
CalculatedNPV=
$1,297.70
PROJECTB
EOY0
EOY1
EOY2
CashFlows
-2000
2000
1480
CalculatedIRR=
49.50%
RequiredRate
9.00%
CalculatedNPV=
$1,080.55
DATATABLEFORNPVPROFILES
ReqdRates
NPVA
NPVB
0%
$1,900.00
$1,480.00
1%
$1,825.12
$1,431.04
2%
$1,752.40
$1,383.31
3%
$1,681.78
$1,336.79
4%
$1,613.17
$1,291.42
5%
$1,546.49
$1,247.17
6%
$1,481.67
$1,203.99
7%
$1,418.64
$1,161.85
8%
$1,357.34
$1,120.71
9%
$1,297.70
$1,080.55
10%
$1,239.67
$1,041.32
11%
$1,183.18
$1,003.00
12%
$1,128.19
$965.56
13%
$1,074.63
$928.97
14%
$1,022.47
$893.20
15%
$971.64
$858.22
16%
$922.12
$824.02
17%
$873.84
$790.56
18%
$826.77
$757.83
19%
$780.88
$725.80
20%
$736.11
$694.44
21%
$692.44
$663.75
22%
$649.83
$633.70
23%
$608.24
$604.27
24%
$567.64
$575.44
25%
$528.00
$547.20
26%
$489.29
$519.53
27%
$451.48
$492.40
28%
$414.55
$465.82
29%
$378.46
$439.76
30%
$343.20
$414.20
31%
$308.72
$389.14
32%
$275.02
$364.55
33%
$242.07
$340.44
34%
$209.85
$316.77
35%
$178.33
$293.55
36%
$147.49
$270.76
37%
$117.32
$248.39
38%
$87.80
$226.42
39%
$58.90
$204.85
40%
$30.61
$183.67
41%
$2.92
$162.87
42%
($24.20)
$142.43
43%
($50.76)
$122.35
44%
($76.77)
$102.62
45%
($102.26)
$83.23
46%
($127.23)
$64.18
47%
($151.70)
$45.44
48%
($175.68)
$27.03
49%
($199.18)
$8.92
50%
($222.22)
($8.89)
Workbook6.6:
ProjectRankingWithinMutuallyExclusiveProjects.
DemonstratingConfictRankingBetweenNPVandIRR,ProjectsBigandSmall.
ProjectsBS,DataandComputations
EOY0
EOY1
EOY2
EOY3
ProjectB
CashFlows
-100000
0
0
147000
ProjectS
CashFlows
-100
0
0
350
ReqdRate
10%
RESULTS
COMMENTS
NPV
IRR
B
$10,443.28
13.70%
UsingNPV,SelectBig.
S
$162.96
51.83%
UsingIRR,SelectSmall
Workbook6.7DemonstratingNPVandIRRConflictWithTimingPatternDifferences.
WithinMutuallyExclusiveProjects.
ProjectsNandF,ProjectDataandComputations
EOY0
EOY1
EOY2
EOY3
ProjectN
CashFlows
-1150
1000
400
100
ProjectF
CashFlows
-1150
100
500
1100
ReqdRate
10.00%
RESULTS
COMMENTS
NPV
IRR
N
$164.80
21.48%
UsingNPV,SelectF
F
$180.58
16.50%
UsingIRR,SelectN
WorkSheet6.7:
Extension
DemonstratingConflictBewteenIRRandNPVinMutuallyExclusiveInvestments
WithPlotofNPVProfiles
DATATABLEFORNPVPROFILES
ReqdRates
NPVN
NPVF
0.00%
$350.00
$550.00
1.00%
$329.28
$506.81
2.00%
$309.09
$465.18
3.00%
$289.43
$425.04
4.00%
$270.26
$386.33
5.00%
$251.58
$348.97
6.00%
$233.36
$312.92
7.00%
$215.58
$278.10
8.00%
$198.24
$244.48
9.00%
$181.32
$211.98
10.00%
$164.80
$180.58
11.00%
$148.67
$150.21
12.00%
$132.91
$120.84
13.00%
$117.52
$92.42
14.00%
$102.48
$64.92
15.00%
$87.77
$38.30
16.00%
$73.40
$12.51
17.00%
$59.34
$12.47
18.00%
$45.59
$36.67
19.00%
$32.14
$60.13
20.00%
$18.98
$82.87
21.00%
$6.10
$104.93
22.00%
$6.51
$126.32
23.00%
$18.86
$147.09
24.00%
$30.95
$167.24
25.00%
$42.80
$186.80
26.00%
$54.41
$205.80
27.00%
$65.78
$224.25
28.00%
$76.93
$242.18
29.00%
$87.85
$259.60
30.00%
$98.57
$276.54
31.00%
$109.07
$293.00
32.00%
$119.38
$309.01
33.00%
$129.49
$324.59
34.00%
$139.40
$339.74
35.00%
$149.14
$354.49
36.00%
$158.69
$368.85
37.00%
$168.07
$382.82
38.00%
$177.27
$396.43
39.00%
$186.31
$409.68
40.00%
$195.19
$422.59
41.00%
$203.91
$435.18
42.00%
$212.48
$447.44
43.00%
$220.89
$459.39
44.00%
$229.16
$471.04
45.00%
$237.29
$482.40
46.00%
$245.28
$493.49
47.00%
$253.14
$504.30
48.00%
$260.86
$514.85
49.00%
$268.46
$525.14
50.00%
$275.93
$535.19
Workbook6.8:
DemonstratingReplacementChainNPVCalculations.
CashFlowData:
TheNPVValueateachreplicationdate
EOY0
EOY1
EOY2
EOY3
Project
Short
$627
$627
$627
Long
$1,582
RequiredRate
10.00%
RESULTS:
CurrentNPVsofReplications
Short
$1,715[1]
Long
$1,582
Workbook6.9:
CalculatingOptimumReplacementTimingWithinanInf


- 配套讲稿:
如PPT文件的首页显示word图标,表示该PPT已包含配套word讲稿。双击word图标可打开word文档。
- 特殊限制:
部分文档作品中含有的国旗、国徽等图片,仅作为作品整体效果示例展示,禁止商用。设计者仅对作品中独创性部分享有著作权。
- 关 键 词:
- 精品 最新 来自 国外 房地产 投资 财务 评估 资料
 冰豆网所有资源均是用户自行上传分享,仅供网友学习交流,未经上传用户书面授权,请勿作他用。
 广东省普通高中学业水平考试数学科考试大纲Word文档下载推荐.docx
-
计算题测试文档格式.docx
-
会计年终总结范文精选10篇Word文件下载.docx
-
基坑支护及降排水方案Word格式文档下载.docx
-
古代诗歌鉴赏一剪梅学案Word文档格式.docx
-
国标舞考级Word文件下载.docx
-
机电工程质量验收规范是什么Word文档下载推荐.docx
-
技术员工作自我评价文档格式.docx
-
交警支队车棚改造工程施工合同文档格式.docx
-
护士变更注册申请审核表与示范文本Word文档下载推荐.docx
-
最新学校新冠肺炎疫情防控应急预案Word文件下载.docx
-
GB50204钢筋规范之欧阳总创编Word格式文档下载.docx
-
《半期整改措施》Word格式.docx
-
诊断 症状学腰背痛关节痛汇总.docx
-
英美文学欣赏The Analysis of Shelleys Ode to the West Wind.docx
-
增值税营改增所得税消费税车购税测试题.docx
-
整理二级建造师管理真题.docx
-
英语三级重点高频词汇导入背单词APP使用.docx
-
浙教版学年九年级数学上册第2章测试题及答案.docx
-
证件照教学设计方案.docx
-
优品课件之《从锁国走向开国的日本》教案.docx
-
整理北京交通大学万用表组装实验报告.docx
-
质量管理计划.docx
-
有机化学鉴别.docx
-
整理照明灯饰灯具行业分类英语词汇.docx
-
濉溪县城市总体规划公示.docx
-
智能化工程质量验收记录表.docx
-
学生会纪检部工作总结.docx
-
幼儿园保教主任发言稿.docx
-
跆拳道协会工作总结.docx
-
中国茶叶店连锁市场竞争分析与竞争战略研究报告.docx
-
学宪法讲宪法主题演讲稿800字精选5篇弘扬宪法精神演讲稿5篇.docx
-
最全的熬粥方法.docx
-
落地架搭设方案.docx
-
最新《珍爱生命远离毒品》教案集6篇资料.docx
-
自学考试《网络操作系统》简答题.docx
-
煤矿安全系统生产实用标准化持续改进工作规章制度0714.docx
-
绿化养护作业安全和环境保护措施方案.docx
-
煤矿双重预防工作方案.docx
-
租金收缴总结.docx
-
最新餐饮服务员培训手册资料.docx
-
最牛的句子.docx
-
最新感恩母亲节祝福语超火文案80句.docx
-
秘书学案例.docx
-
最新 幼儿园升国旗演讲稿精选多篇 讲话 致辞.docx
-
煤矿安全承诺书范文合集8篇.docx
-
面试试题大全汇编.docx
-
最新版万科住宅性能标准.docx
-
最新九年义务教育全日制初级中学物理教学大纲试用修订版资料.docx
-
美国波士顿大学这10个地方是学霸们的最爱.docx
-
最新年医疗器械经营企业自查报告参考格式资料.docx
