 APStatisticsMultipleChoiceExam统计选择题.docx
- 文档编号:4682384
- 上传时间:2022-12-07
- 格式:DOCX
- 页数:19
- 大小:102.52KB
APStatisticsMultipleChoiceExam统计选择题.docx
《APStatisticsMultipleChoiceExam统计选择题.docx》由会员分享,可在线阅读,更多相关《APStatisticsMultipleChoiceExam统计选择题.docx(19页珍藏版)》请在冰豆网上搜索。
APStatisticsMultipleChoiceExam统计选择题
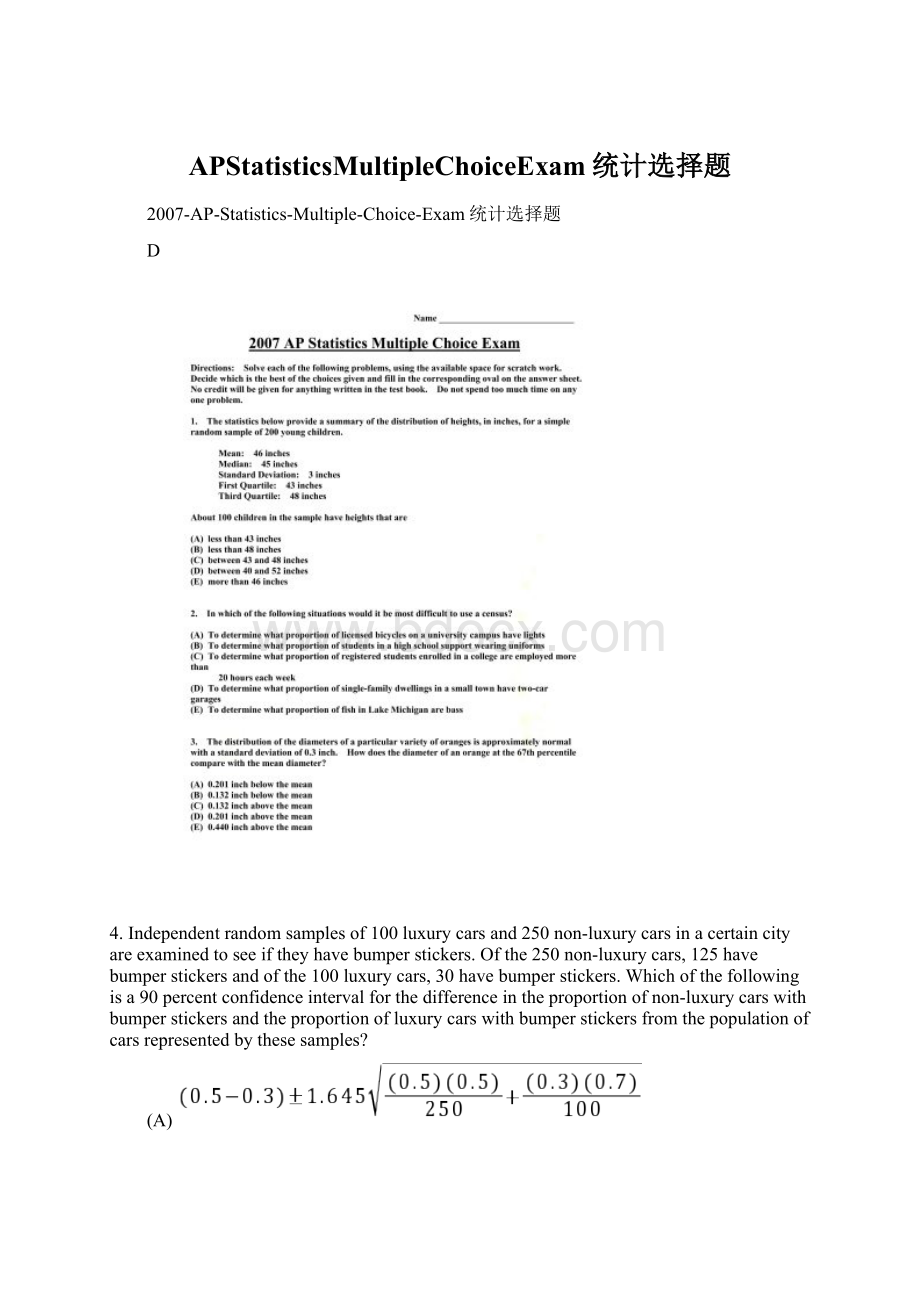
2007-AP-Statistics-Multiple-Choice-Exam统计选择题
D
4.Independentrandomsamplesof100luxurycarsand250non-luxurycarsinacertaincityareexaminedtoseeiftheyhavebumperstickers.Ofthe250non-luxurycars,125havebumperstickersandofthe100luxurycars,30havebumperstickers.Whichofthefollowingisa90percentconfidenceintervalforthedifferenceintheproportionofnon-luxurycarswithbumperstickersandtheproportionofluxurycarswithbumperstickersfromthepopulationofcarsrepresentedbythesesamples?
(A)
(B)
(C)
(D)
(E)
5.Asafetygroupclaimsthatthemeanspeedofdriversonahighwayexceedsthepostedspeedlimitof65milesperhour(mph).Toinvestigatethesafetygroup'sclaim,whichofthefollowingstatementsisappropriate?
(A)Thenullhypothesisisthatthemeanspeedofdriversonthishighwayislessthan65mph.
(B)Thenullhypothesisisthatthemeanspeedofdriversonthishighwayisgreaterthan65mph.
(C)Thealternativehypothesisisthatthemeanspeedofdriversonthishighwayisgreaterthan65mph.
(D)Thealternativehypothesisisthatthemeanspeedofdriversonthishighwayislessthan65mph.
(E)Thealternativehypothesisisthatthemeanspeedofdriversonthishighwayisgreaterthanorequal
to65mph.
6.Afaircoinistobeflipped5times.Thefirst4flipsland"heads"up.Whatistheprobabilityof"heads"onthenext(5th)flipofthiscoin?
(A)
(B)
(C)
(D)
(E)
7.Thestemplotbelowshowstheyearlyearningspershareofstockfortwodifferentcompaniesoverasixteen-yearperiod.
CompanyACompanyB
058,75,96,98
92,91,90,82,78,43,38,26101,10,17,21,43,43,53,65,73
49,47,44,00209,27,29
73,27,05,023
Whichofthefollowingstatementsistrue?
(A)ThemedianoftheearningsofCompanyAislessthanthemedianoftheearningsoftheCompanyB.
(B)TherangeoftheearningsofCompanyAislessthantherangeoftheearningsofCompanyB.
(C)ThethirdquartileofCompanyAissmallerthanthethirdquartileofCompanyB.
(D)ThemeanoftheearningsofCompanyAisgreaterthanthemeanoftheearningsofCompanyB.
(E)TheinterquartilerangeofCompanyAistwicetheinterquartilerangeofCompanyB.
8.LetXrepresentarandomvariablewhosedistributionisnormal,withameanof100andastandarddeviationof10.WhichofthefollowingisequivalenttoP(X>115)?
(A)P(X<115)
(B)P(X≤115)
(C)P(X<85)
(D)P(85 (E)1-P(X<85) 9.Atelevisionnewseditorwouldliketoknowhowlocalregisteredvoterswouldrespondtothequestion,"Areyouinfavoroftheschoolbondmeasurethatwillbevotedoninanupcomingspecialelection? "Atelevisionsurveyisconductedduringabreakintheeveningnewsbylistingtwotelephonenumberssidebysideonthescreen,oneforviewerstocalliftheyapproveofthebondmeasure,andtheothertocalliftheydisapprove.Thissurveymethodcouldproducebiasedresultsforanumberofreasons.Whichoneofthefollowingisthemostobviousreason? (A)Itusesastratifiedsampleratherthanasimplerandomsample. (B)Peoplewhofeelstronglyabouttheissuearemorelikelytorespond. (C)Viewersshouldbetoldabouttheissuesbeforethesurveyisconducted. (D)Someregisteredvoterswhocallmightnotvoteintheelection. (E)Thewordingofthequestionisbiased. 10.Ahighschoolphysicsteacherwasconductinganexperimentwithhisclassonthelengthoftimeitwilltakeamarbletorolldownaslopedchute.Theclassranrepeatedtrialsinordertodeterminetherelationshipbetweenthelength,incentimeters,oftheslopedchuteandthetime,inseconds,forthemarbletorolldownthechute.Alinearrelationshipwasobservedandthecorrelationcoefficientwas0.964.Afterdiscussingtheirresults,theteacherinstructedthestudentstoconvertallofthelengthmeasurementstometersbutleavethetimeinseconds.Whateffectwillthishaveonthecorrelationofthetwovariables? (A)Becausethestandarddeviationofthelengthsinmeterswillbeonehundredthofthestandard deviationofthelengthsincentimeters,thecorrelationwilldecreasebyonehundredthto0.954. (B)Becausethestandarddeviationofthelengthsinmeterswillbeonehundredthofthestandard deviationofthelengthsincentimeters,thecorrelationwilldecreaseproportionallyto0.00964. (C)Becausechangingfromcentimeterstometersdoesnotaffectthevalueofthecorrelation,the correlationwillremain0.964. (D)Becauseonlythelengthmeasurementshavebeenchanged,thecorrelationwilldecrease substantially. (E)Becausemetersareamuchmorecommonmeasurementforlengthindeterminingspeed,thelinear relationshipofthedatawillbestrongerandthusthecorrelationwillincreasesubstantially. 11.Juliegeneratesasampleof20randomintegersbetween0and9inclusive.Sherecordsthenumberof6'sinthesample.Sherepeatsthisprocess99moretimes,recordingthenumberof6'sineachsample.Whatkindofdistributionhasshesimulated? (A)Thesamplingdistributionofthesampleproportionwithn=20andp=0.6 (B)Thesamplingdistributionofthesampleproportionwithn=100andp=0.1 (C)Thebinomialdistributionwithn=20andp=0.1 (D)Thebinomialdistributionwithn=100andp=0.1 (E)Thebinomialdistributionwithn=20andp=0.6 n Mean Median SampleI 21 42.6 45.0 SampleII 26 49.2 48.5 12.Thetableaboveshowsthesamplesize,themean,andthemedianfortwosamplesofmeasurements.Whatisthemedianforthecombinedsampleof47measurements? (A) (B) (C) (D) (E)Itcannotbedeterminedfromtheinformationgiven. 13.Dan,atraineratthePopularGym,wasinterestedincomparinglevelsofphysicalfitnessofstudentsattendinganearbycommunitycollegeandthoseattendinga4-yearcollegeintown.Heselectedarandomsampleof320studentsfromthecommunitycollege.Themeanandstandarddeviationoftheirfitnessscoreswere95and10,respectively.Danalsoselectedarandomsampleof320studentsfroma4-yearcollege.Themeanandstandarddeviationoftheirfitnessscoreswere 92and13,respectively.Hethenconductedatwo-sidedt-testthatresultedinat-valueof3.27.Whichofthefollowingisanappropriateconclusionfromthisstudy? (A)Becausethesamplemeansonlydifferedby3,thepopulationmeansarenotsignificantlydifferent. (B)Becausethesecondgrouphadalargerstandarddeviation,theirmeanfitnessscoreissignificantly higher. (C)Becausethesecondgrouphadalargerstandarddeviation,themeanfitnessscoreofthefirstgroup issignificantlyhigher. (D)Becausethep-valueislessthanα=0.05,themeanfitnessscoresforthetwogroupsofstudents aresignificantlydifferent. (E)Becausethep-valueisgreaterthanα=0.05,themeanfitnessscoresforthetwogroupsofstudents aresignificantlydifferent. 14.Aresearcherwishestotestanewdrugdevelopedtotreathypertension(highbloodpressure).Agroupof40hypertensivemenand60hypertensivewomenistobeused.Theexperimenterrandomlyassigns20ofthemenand30ofthewomentotheplaceboandassignstheresttothetreatment.Themajorreasonforseparateassignmentformenandwomenisthat (A)itisalargestudywith100subjects (B)thenewdrugmayaffectmenandwomendifferently (C)thenewdrugmayaffecthypertensiveandnonhypertensivepeopledifferently (D)thisdesignusesmatchedpairstodetectthenew-drugeffect (E)theremustbeanequalnumberofsubjectsinboththeplacebogroupandthetreatmentgroup. 15.Thehistogramsbelowrepresentthedistributionoffivedifferentdatasets,eachcontaining28integers,from1through7,inclusive.Thehorizontalandverticalscalesarethesameforallgraphs.Whichgraphrepresentsthedatasetwiththelargeststandarddeviation. (A)(B)(C) (D)(E) 16.LynnisplanningtoflyfromNewYorktoLosAngelesandwilltaketheAirtightAirlinesflightthatleavesat8A.M.TheWebsitesheusedtomakeherreservationstatesthattheprobabilitythattheflightwillarriveinLosAngelesontimeis0.70.Ofthefollowing,whichisthemostreasonableexplanationforhowthatprobabilitycouldhavebeenestimated? (A)Byusinganextendedweatherforecastforthedateofherflight,whichshoweda30%chanceof badweather (B)Bymakingassumptionsabouthowairplaneswork,andfactoringallofthoseassumptionsintoan equationtoarriveattheprobability (C)Fromthefactthat,ofallairlineflightsarrivinginCalifornia,70%arriveontime (D)Fromthefactthat,ofallairlineflightsintheUnitedStates,70%arriveontime (E)Fromthefactthat,onallpreviousdaysthisparticularflighthadbeenscheduled,ithadarrivedon time70%ofthosedays 17.Inanexperiment,twodifferentspeciesofflowerswerecrossbred.Theresultingflowersfromthiscrossbreedingexperimentwereclassified,bycolorofflowerandstigma,intooneoffourgroups,asshowninthetablebelow. FlowerTypeResultingfromCrossbreeding NumberofFlowersObservedwithTheseColors I: Magentalowerwithgreenstigma 115 II: Magentaflowerwithredstigma 49 III: Redflowerwithgreenstigma 32 IV: Redflowerwithredstigma 21 Abiologistexpectedthattheratioof9: 3: 3: 1fortheflowertypesI: II: III: IV,respectively,wouldresultfromthiscrossbreedingexperiment.Fromthedataabove,a valueofapproximately8.04wascomputed.Aretheobservedresultsinconsistentwiththeexpectedratioatthe5percentlevelofsignificance? (A)Yes,becausethecomputed valueisgreat


- 配套讲稿:
如PPT文件的首页显示word图标,表示该PPT已包含配套word讲稿。双击word图标可打开word文档。
- 特殊限制:
部分文档作品中含有的国旗、国徽等图片,仅作为作品整体效果示例展示,禁止商用。设计者仅对作品中独创性部分享有著作权。
- 关 键 词:
- APStatisticsMultipleChoiceExam 统计 选择题
 冰豆网所有资源均是用户自行上传分享,仅供网友学习交流,未经上传用户书面授权,请勿作他用。
 《雷雨》中的蘩漪人物形象分析 1.docx
-
《经济法基础》第三章章节练习与答案解析.docx
-
安徽省合肥市包河区卫生健康系统招聘试题及答案解析.docx
-
《河中石兽》复习过程.docx
-
版二级建造师《公路工程管理与实务》考前检测 附答案.docx
-
保密安全制度监理组5篇修改版.docx
-
北师大版届九年级上学期期末考试英语试题I卷.docx
-
PACE产品及周期优化法系统结构复习课程.docx
-
常规变电站常规设计.docx
-
初三欧姆定律计算题题型整理.docx
-
《测绘管理与法律法规》模拟试题一附答案.docx
-
2测风工岗位练兵技术比武.docx
-
《小学语文不同课型的教学模式参考》1.docx
-
15高考宁夏英语及答案教学内容.docx
-
ABS圆形笔筒课程设计说明书.docx
-
c语言程序填空题.docx
-
茶艺师高级三级教学计划大纲.docx
-
场平土石方工程施工项目组织设计.docx
-
《人力资源管理》期末试题及答案教学内容.docx
-
《河南省高等学校教师实验人员中高级专业技术职务任职资格申报评审条件试行.docx
-
01钢结构制作施工工艺标准文档.docx
-
IIR数字滤波器的设计流程图.docx
-
005纺丝作业指导书.docx
-
1991高考化学试题.docx
-
GMP审核检查表与审核员指南.docx
-
成本会计试题二.docx
-
14001讲师心态调整培训讲座讲义体验版共14页文档.docx
-
cpld矩阵键盘.docx
-
《金融服务营销》.docx
-
NHR100过程校验仪140408.docx
-
Q+ Web 改版设计小结.docx
-
八年级上册古诗词鉴赏含参考答案.docx
-
逃生演练作文6.docx
-
用DS1302与LCD1602设计的可调式电子日历时钟的设计与实现.docx
-
长沙知名律师李青云解读建设工程施工合同司法解释最新范本模板.docx
-
造影剂注射小知识.docx
-
注册监理工程师投资知识点整理.docx
-
怎样做统计报表doc.docx
-
小学生好词好句好段摘抄大全精.docx
-
隧道施工专项方案.docx
-
同分母分数加减法教学设计及反思.docx
-
直流稳压电源设计.docx
-
液压支架附录4综采工作面三机配套附图.docx
-
最新毕业基于at89c51单片机的烟雾报警器设计.docx
-
学生诚信考试承诺书10篇.docx
-
园林工程技术交底.docx
-
中国古代器皿名称与器形.docx
-
唐山年度中考信息技术科目模拟卷doc 9页.docx
-
箱梁预制场.docx
-
学生志愿者社会实践报告范本5篇.docx
-
邮政营业员操作技能考核大纲初中高.docx
