 调节效应图(绘制).xls
- 文档编号:30802101
- 上传时间:2024-01-28
- 格式:XLS
- 页数:28
- 大小:77KB
调节效应图(绘制).xls
《调节效应图(绘制).xls》由会员分享,可在线阅读,更多相关《调节效应图(绘制).xls(28页珍藏版)》请在冰豆网上搜索。

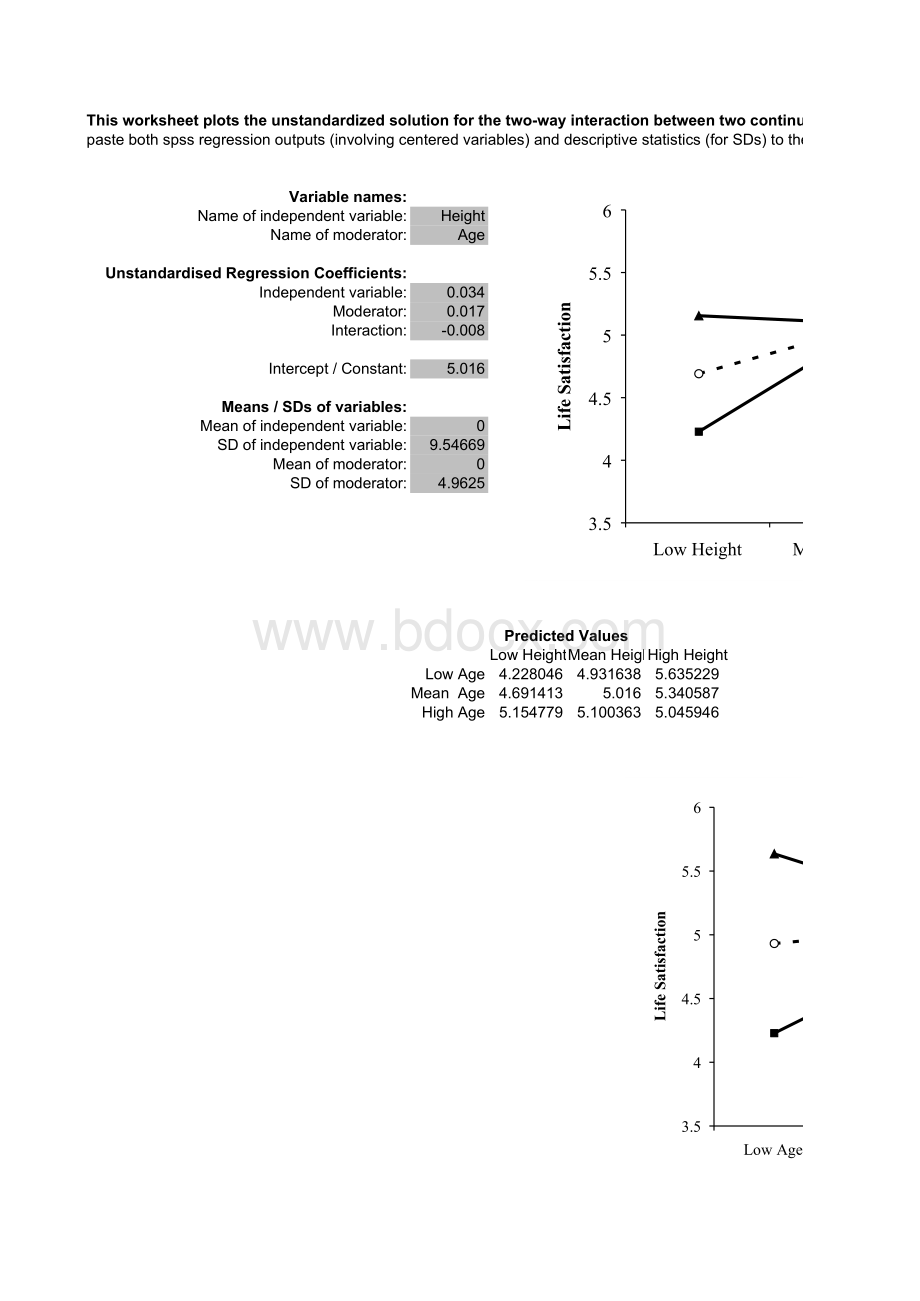
Thisworksheetplotstheunstandardizedsolutionforthetwo-wayinteractionbetweentwocontinuousvariables(两两连连续续变变量量中中心心化化高高低低图图)pastebothspssregressionoutputs(involvingcenteredvariables)anddescriptivestatistics(forSDs)totherightandcheckexcellinksVariablenames:
Nameofindependentvariable:
HeightNameofmoderator:
AgeUnstandardisedRegressionCoefficients:
Independentvariable:
0.034Moderator:
0.017Interaction:
-0.008Intercept/Constant:
5.016Means/SDsofvariables:
Meanofindependentvariable:
0SDofindependentvariable:
9.54669Meanofmoderator:
0SDofmoderator:
4.9625PredictedValuesLowHeightMeanHeightHighHeightLowAge4.2280464.9316385.635229MeanAge4.6914135.0165.340587HighAge5.1547795.1003635.045946LowHeightMeanHeightHighHeight3.544.555.56LifeSatisfactionLowAgeMeanAgeHighAgeLowAgeMeanAgeHighAge3.544.555.56LifeSatisfactionLowHeightMeanHeightHighHeightUnstandardizedCoefficientsModelB1(Constant)4.975heightc0.031agec0.0242(Constant)5.016heightc0.034agec0.017heightc.agec-0.008a.DependentVariable:
lifesatDescriptiveStatisticsNMeanheightc800agec800ValidN(listwise)80alternativepresentationThisworksheetplotstheunstandardizedsolutionforthetwo-wayinteractionbetweentwocontinuousvariables(两两连连续续变变量量中中心心化化高高低低图图)pastebothspssregressionoutputs(involvingcenteredvariables)anddescriptivestatistics(forSDs)totherightandcheckexcellinksLowHeightMeanHeightHighHeight3.544.555.56LifeSatisfactionLowAgeMeanAgeHighAgeLowAgeMeanAgeHighAge3.544.555.56LifeSatisfactionLowHeightMeanHeightHighHeightCoefficients(a)StandardizedCoefficientsStd.ErrorBetatSig.0.1533.0700.0160.2151.9330.0570.0310.0850.7670.4460.14734.01800.0160.242.2040.0310.030.0610.5610.5760.003-0.251-2.3080.024Std.Deviation9.546694.9625UnstandardizedCoefficientsThisworksheetplotsthestandardizedsolutionforthetwo-wayinteractionbetweentwocontinuousvariables(这这个个是是两两连连续续变变量量交交互互效效应应标标准准化化结结果果的的高高低低图图)regressioncoefficientsarespssoutputsforBinaregressioninvolvingz-standardizedvariables(seeAiken&West,1991;Friedrich,1982)forstandardizedcontvariables,themeanisalways0andtheSDis1Variablenames:
Nameofindependentvariable:
HeightNameofmoderator:
AgeUnstandardisedRegressionCoefficients:
Independentvariable:
0.24Moderator:
0.061Interaction:
-0.27Intercept/Constant:
0.03Means/SDsofvariables:
Meanofindependentvariable:
0SDofindependentvariable:
1Meanofmoderator:
0SDofmoderator:
1PredictedValuesLowHeightMeanHeightHighHeightLowAge-0.541-0.0310.479MeanAge-0.210.030.27HighAge0.1210.0910.061LowHeightMeanHeightHighHeight-1-0.500.51LifeSatisfactionLowAgeMeanAgeHighAgeLowAgeMeanAgeHighAge-1-0.500.51LifeSatisfactionLowHeightMeanHeightHighHeightLowAgeMeanAgeHighAge-1-0.500.51LifeSatisfactionLowHeightMeanHeightHighHeight从阴影部分开始粘贴spss的数据表格Model1(Constant)Zscore(height)Zscore(age)2(Constant)Zscore(height)Zscore(age)zheight.zagea.DependentVariable:
Zscore(lifesat)alternativepresentationThisworksheetplotsthestandardizedsolutionforthetwo-wayinteractionbetweentwocontinuousvariables(这这个个是是两两连连续续变变量量交交互互效效应应标标准准化化结结果果的的高高低低图图)regressioncoefficientsarespssoutputsforBinaregressioninvolvingz-standardizedvariables(seeAiken&West,1991;Friedrich,1982)LowHeightMeanHeightHighHeight-1-0.500.51LifeSatisfactionLowAgeMeanAgeHighAgeLowAgeMeanAgeHighAge-1-0.500.51LifeSatisfactionLowHeightMeanHeightHighHeightLowAgeMeanAgeHighAge-1-0.500.51LifeSatisfactionLowHeightMeanHeightHighHeightCoefficients(a)UnstandardizedCoefficientsStandardizedCoefficientsBStd.ErrorBetatSig.-3.87E-160.11010.2150.1110.2151.9330.0570.0850.1110.0850.7670.4460.030.1080.2770.7830.240.1090.242.2030.0310.0610.1090.0610.5610.576-0.270.117-0.251-2.3080.024从阴影部分开始粘贴spss的数据表格a.DependentVariable:
Zscore(lifesat)Thisworksheetplotstheunstandardizedsolutionforthetwo-wayinteractionbetweenacontinuousvariableandadummy-codeddichotomousmoderator.(一一个个连连续续变变量量和和一一个个哑哑变变量量的的中中心心化化高高低低图图)Themoderatorshouldhavevalues0and1.(foreffectscoding,seealternativesheet)Variablenames:
Nameofindependentvariable:
HeightMeaningofmoderatorvalue0WomenMeaningofmoderatorvalue1MenUnstandardisedRegressionCoefficients:
Intercept/Constant:
4.966Independentvariable:
0.005Moderator:
-0.199Interaction:
0.073Means/SDsofvariables:
Meanofindependentvariable:
0SDofindependentvariable:
9.54669PredictedValuesLowHeight(-1SD)HighHeight(+1SD)Women4.925.01Men4.025.51LowHeight(-1SD)HighHeight(+1SD)3.804.304.805.305.80LifeSatisfactionWomenMenThisworksheetplotstheunstandardizedsolutionforthetwo-wayinteractionbetweenacontinuousvariableandadummy-codeddichotomousmoderator.(一一个个连连续续变变量量和和一一个个哑哑变变量量的的中中心心化化高高低低图图)LowHeight(-1SD)HighHeight(+1SD)3.804.304.805.305.80LifeSatisfactionWomenMenCoefficients(a)UnstandardizedCoefficientsStandardizedCoefficientsModelBStd.ErrorBetatSig.1(Constant)5.0550.21923.0750heightc0.0350.0170.2432.0820.041genderd-0.1590.318-0.059-0.5010.6182(Constant)4.9660.21822.8070heightc0.0050.0210.0360.2450.807genderd-0.1990.311-0.073-0.6410.523genderd.heightc0.0730.0330.3182.1840.032a.DependentVariable:
lifesatDescriptiveStatisticsNMeanStd.Deviationheightc8009.54669ValidN(listwise)80WomenMen3.003.504.004.505.005.506.00LifeSatisfactionLowHeight(-1SD)HighHeight(+1SD)Thisworksheetplotstheunstandardizedsolutionforthetwo-wayinteractionbetweenacontinuousvariableandadummy-codeddichotomousmoderator.(一一个个连连续续变变量量和和一一个个哑哑变变量量的的中中心心化化高高低低图图)alternativerepresentation:
WomenMen3.003.504.004.505.005.506.00LifeSatisfactionLowHeight(-1SD)HighHeight(+1SD)Thisworksheetplotsthestandardizedsolutionforthetwo-wayinteractionbetweenacontinuousvariableandadummy-codeddichotomousmoderator.Themoderatorshouldhavevalues0and1.(foreffectscoding,seealternativesheet)Variablenames:
Nameofindependentvariable:
HeightMeaningofmoderatorvalue0WomenMeaningofmoderatorvalue1MenUnstandardisedRegressionCoefficients:
Intercept/Constant:
-0.007Independentvariable:
0.036Moderator:
-0.146Interaction:
0.507PredictedvaluesLowHeight(-1SD)HighHeight(+1SD)Women-0.0430.029Men-0.6960.39LowHeight(-1SD)HighHeight(+1SD)-1-0.500.51Z-StandardizedLifeSatisfactionWomenMenThisworksheetplotsthestandardizedsolutionforthetwo-wayinteractionbetweenacontinuousvariableandadummy-codeddichotomousmoderator.LowHeight(-1SD)HighHeight(+1SD)-1-0.500.51Z-StandardizedLifeSatisfactionWomenMenCoefficients(a)UnstandardizedCoefficientsStandardizedCoefficientsModelBStd.ErrorBetatSig.1(Constant)0.0580.160.3640.717Zscore(height)0.2430.1170.2432.0820.041genderd-0.1160.232-0.059-0.5010.6182(Constant)-0.0070.159-0.0430.966Zscore(height)0.0360.1480.0360.2450.807genderd-0.1460.227-0.073-0.6410.523genderd.zheight0.5070.2320.3182.1840.032a.DependentVariable:
Zscore(lifesat)Thisworksheetplotstheunstandardizedsolutionforatwo-wayinteractionbetweenacontinuousandaaneffects-codeddichotomousmoderator.Themoderatorshouldhavevalues-1and1.(fordummycoding,seealternativesheet)Variablenames:
Nameofindependentvariable:
HeightMeaningofmoderatorvalue-1WomenMeaningofmoderatorvalue1MenUnstandardisedRegressionCoefficients:
Independentvariable:
0.042Moderator:
-0.1Interaction:
0.036Intercept/Constant:
4.866Means/SDsofvariables:
Meanofindependentvariable:
0SDofindependentvariable:
9.547predictedvaluesLowHeightHighHeightWomen4.915.02MeanEffect4.475.27Men4.025.51LowHeightHighHeight3.003.504.004.505.005.506.00LifeSatisfactionWomenMeanEffectMenThisworksheetplotstheunstandardizedsolutionforatwo-wayinteractionbetweenacontinuousandaaneffects-codeddichotomousmoderator.LowHeightHighHeight3.003.504.004.505.005.506.00LifeSatisfactionWomenMeanEffectMenCoefficients(a)UnstandardizedCoefficientsStandardizedCoefficientsModelBStd.ErrorBetatSig.1(Constant)4.9750.15132.9980heightc0.0350.0170.2432.0820.041gendere-0.080.159-0.059-0.5010.6182(Constant)4.8660.15531.3050heightc0.0420.0170.292.4980.015gendere-0.10.155-0.073-0.6410.523gendere.heightc0.0360.0170.2412.1840.032a.DependentVariable:
lifesatDescriptiveStatisticsNMeanStd.Deviationheightc8009.547ValidN(listwise)80Thisworksheetplotsthestandardizedsolutionforatwo-wayinteractionbetweenacontinuousandaaneffects-codeddichotomousmoderatorThemoderatorshouldhavevalues-1and1.(fordummycoding,seealternativesheet)Variablenames:
Nameofindependentvariable:
HeightMeaningofmoderatorvalue-1WomenMeaningofmoderatorvalue1MenUnstandardisedRegressionCoefficients:
Independentvariable:
0.29Moderator:
-0.073Interaction:
0.254Intercept/Constant:
-0.08Means/SDsofvariables:
Meanofindependentvariable:
0SDofindependentvariable:
1predictedvaluesLowHeightHighHeightWomen-0.040.03MeanEffect-0.370.21Men-0.700.39LowHeightHighHeight-1.00-0.500.000.501.00DependentvariableWomenMeanEffectMenThisworksheetplotsthestandardizedsolutionforatwo-wayinteractionbetweenacontinuousandaaneffects-codeddichotomousmoderatorLowHeightHighHeight-1.00-0.500.000.501.00DependentvariableWomenMeanEffectMenCoefficients(a)UnstandardizedCoefficientsStandardizedCoefficientsModelBStd.ErrorBetatSig.1(Constant)-4.01E-160.1101Zscore(height)0.2430.1170.2432.0820.041gendere-0.0580.116-0.059-0.5010.6182(Constant)-0.080.114-0.7020.485Zscore(height)0.290.1160.292.4980.015gendere-0.0730.114-0.073-0.6410.523gendere.zheight0.2540.1160.2412.1840.032a.DependentVariable:
Zscore(lifesat)Thisworksheetplotsthree-wayinteractioneffectsforstandardisedvariables.Usethehigh/lowvaluesboxestoindicatethevaluesforwhichtheplotshouldbemade(i.e.denotez-standardizedvarswith-1and1;dummycodedvarswith0and1,andeffectscodedvarswith-1and1here)Variablenames:
Nameofvariable1(X):
HeightNameofvariable2:
(Z)AgeNameofvariable3(W):
GenderStandardisedregressioncoefficients:
Var1:
0.029Var2:
-0.019Var3:
0.056Var1*Var2:
0.0
- 配套讲稿:
如PPT文件的首页显示word图标,表示该PPT已包含配套word讲稿。双击word图标可打开word文档。
- 特殊限制:
部分文档作品中含有的国旗、国徽等图片,仅作为作品整体效果示例展示,禁止商用。设计者仅对作品中独创性部分享有著作权。
- 关 键 词:
- 调节 效应 绘制
 冰豆网所有资源均是用户自行上传分享,仅供网友学习交流,未经上传用户书面授权,请勿作他用。


 江南大学现代远程教育 考试大作业1.docx
 美术开学第一课-二年级.pptx
