 flex3D饼图与3D柱状图.docx
- 文档编号:28125794
- 上传时间:2023-07-08
- 格式:DOCX
- 页数:13
- 大小:43.04KB
flex3D饼图与3D柱状图.docx
《flex3D饼图与3D柱状图.docx》由会员分享,可在线阅读,更多相关《flex3D饼图与3D柱状图.docx(13页珍藏版)》请在冰豆网上搜索。
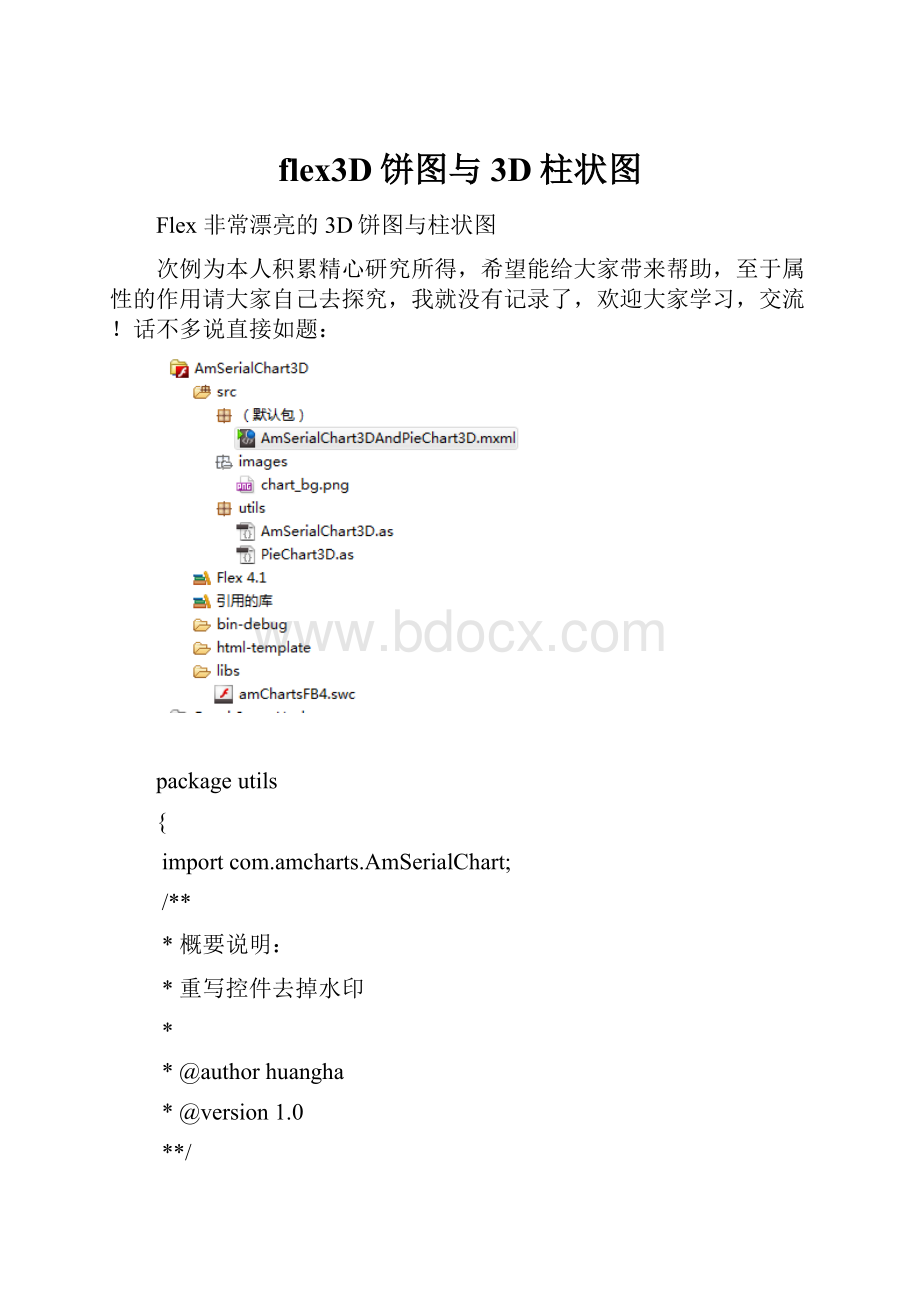
flex3D饼图与3D柱状图
Flex非常漂亮的3D饼图与柱状图
次例为本人积累精心研究所得,希望能给大家带来帮助,至于属性的作用请大家自己去探究,我就没有记录了,欢迎大家学习,交流!
话不多说直接如题:
packageutils
{
importcom.amcharts.AmSerialChart;
/**
*概要说明:
*重写控件去掉水印
*
*@authorhuangha
*@version1.0
**/
publicclassAmSerialChart3DextendsAmSerialChart
{
publicfunctionAmSerialChart3D()
{
super();
}
overrideprotectedfunctioncreateChildren():
void
{
super.createChildren();
if(_amchartsLink)
{
_amchartsLink.visible=false;
_amchartsLink.alpha=0;
_amchartsLink.width=0;
_amchartsLink.height=0;
}
}
}
}
packageutils
{
importcom.amcharts.AmPieChart;
/**
*概要说明:
*重写控件去掉水印
*
*@authorhuangha
*@version1.0
**/
publicclassPieChart3DextendsAmPieChart
{
publicfunctionPieChart3D()
{
super();
}
overrideprotectedfunctioncreateChildren():
void
{
super.createChildren();
if(_amchartsLink)
{
_amchartsLink.visible=false;
_amchartsLink.alpha=0;
_amchartsLink.width=0;
_amchartsLink.height=0;
}
}
}
}
xmlversion="1.0"encoding="utf-8"?
>
--
***************************************************************
*
*(c)Copyright2014
*
*
*ProjectName:
AmSerialChart3DAndPieChart3D
*
*
*AmSerialChart3D.mxml
*
*
*DateVerAuthorDescription
*2014-7-101.00andy非常漂亮使用的3D饼图与柱状图
*Description
*次例为本人积累精心研究所得,希望能给大家带来帮助,至于属性的作用请大家自己去探究,我就没有记录了,欢迎大家学习,交流!
***************************************************************
-->
Applicationxmlns: fx=" xmlns: s="library: // xmlns: mx="library: // width="100%" height="100%" xmlns: utils="utils.*" xmlns: amcharts=" backgroundColor="#EBEBEB"> layout> HorizontalLayoutgap="0"/> layout> Script> [CDATA[ importmx.collections.ArrayCollection; [Bindable] privatevarmyPieData: ArrayCollection=newArrayCollection([{Application: "A",value: 35,color: "0xde244f"},{Application: "B",value: 45,color: "0xea5b7c"},{Application: "C",value: 12,color: "0x0C99E1"},{Application: "D",value: 5,color: "0xD294DF"},{Application: "E",value: 75,color: "0xffd700"},{Application: "F",value: 27,color: "0xC1DC7D"}]); [Bindable] privatevarmyAmSerialData: ArrayCollection=newArrayCollection([{Month: "Jan",Total_Met: 35,Total_Miss: 15,Performance: 80},{Month: "Feb",Total_Met: 60,Total_Miss: 20,Performance: 60},{Month: "Mar",Total_Met: 85,Total_Miss: 18,Performance: 70},{Month: "Apr",Total_Met: 20,Total_Miss: 23,Performance: 95},{Month: "May",Total_Met: 20,Total_Miss: 10,Performance: 67},{Month: "Jun",Total_Met: 75,Total_Miss: 27,Performance: 45},{Month: "Jul",Total_Met: 25,Total_Miss: 12,Performance: 34},{Month: "Aug",Total_Met: 40,Total_Miss: 10,Performance: 55},{Month: "Sep",Total_Met: 89,Total_Miss: 16,Performance: 67},{Month: "Oct",Total_Met: 10,Total_Miss: 5,Performance: 89},{Month: "Nov",Total_Met: 18,Total_Miss: 13,Performance: 66},{Month: "Dec",Total_Met: 55,Total_Miss: 19,Performance: 45}]); ]]> Script> Declarations> --将非可视元素(例如服务、值对象)放在此处--> Declarations> BorderContainerwidth="100%" height="380" backgroundImageFillMode="repeat" backgroundImage="@Embed(source='images/chart_bg.png')" backgroundColor="#EBEBEB"> layout> VerticalLayoutgap="0" horizontalAlign="center"/> layout> PieChart3DfontSize="12" width="100%" height="100%" dataProvider="{myPieData}" valueField="value" titleField="Application" colorField="color" pulledField="value" angle="50" depth3D="30" startDuration="1.5" startRadius="0" labelRadius="{-35}" radius="170" labelsEnabled="true" startAlpha="0.5" id="pieChart" textAlign="left" hideLabelsPercent="5" labelText="[[percents]]%" color="{0xFFFFFF}"> filters> DropShadowFilterblurX="40" blurY="10" angle="150" alpha="0.6" distance="6" quality="1" strength="1"/> filters> balloon> AmBallooncornerRadius="5" borderThickness="1" borderColor="#FFFFFF" borderAlpha=".7"/> balloon> PieChart3D> AmLegendfontFamily="Tahoma" dataProvider="{pieChart}" horizontalGap="15" verticalGap="5" maxColumns="6" align="center" markerLabelGap="5" markerSize="15" useMarkerColorForLabels="false" switchable="false" valueWidth="0" valueText="" textAlign="right" fontSize="12" textClickEnabled="false" color="0x484848" marginBottom="20"> filters> DropShadowFilterblurX="1" blurY="1" angle="45" alpha="0.6" distance="2" quality="1" strength="0.6"/> filters> AmLegend> BorderContainer> BorderContainerwidth="100%" height="380" backgroundImageFillMode="repeat" backgroundImage="@Embed(source='images/chart_bg.png')" backgroundColor="#EBEBEB"> layout> VerticalLayoutgap="0" horizontalAlign="center"/> layout> AmSerialChart3Did="column" width="100%" height="100%" angle="25" depth3D="30" color="0x484848" maxColumnWidth="28" categoryField="Month" startDuration="2" plotAreaFillAlphas="[0]" fontFamily="Tahoma" fontSize="12" dataProvider="{myAmSerialData}"> chartCursor> ChartCursorzoomable="false" cursorAlpha="1"/> chartCursor> categoryAxis> CategoryAxisid="haxis" gridPosition="start" gridColor="#B1B1B1" gridThickness="1" gridAlpha="1" gridCount="10" position="bottom" axisAlpha="1" axisColor="#8B8B8B"/> categoryAxis> valueAxes> ValueAxisposition="left" id="lineValue" stackType="regular" axisAlpha="1" axisColor="#BBBEC0" axisThickness="1" gridAlpha="1" gridColor="#BBBEC0" unit="%" precision="2"/> ValueAxisposition="right" id="columValue" stackType="regular" axisAlpha="1" axisColor="#BBBEC0" axisThickness="1" gridAlpha="0" precision="0"/> valueAxes> graphs> AmGraphid="total_met" width="40" type="column" title="TotalMet" lineColor="#b1db4c" valueField="Total_Met" lineAlpha="1" fillAlphas="1" valueAxis="{columValue}" balloonText="TotalMetin[[category]]: [[value]]"/> AmGraphid="total_miss" width="40" type="column" title="TotalMiss" lineColor="#0f98e7" valueField="Total_Miss" lineAlpha="1" fillAlphas="1" valueAxis="{columValue}" balloonText="TotalMissin[[category]]: [[value]]"/> AmGraphid="line_performance" valueAxis="{lineValue}" type="line" title="Performance(%)" lineColor="#eda637" lineThickness="2" valueField="Performance" bullet="round" bulletBorderThickness="6" bulletBorderColor="#eda637" bulletBorderAlpha="0.6" bulletColor="#FFFFFF" bulletAlpha="1" balloonText="Performancein[[category]]: [[value]][[additional]]%"/> graphs> AmSerialChart3D> AmLegendwidth="100%" fontFamily="Tahoma" dataProvider="{column}" horizontalGap="15" verticalGap="5" maxColumns="10" align="center" markerLabelGap="5" markerSize="15" useMarkerColorForLabels="false" switchable="false" valueWidth="0" valueText="" textAlign="right" fontSize="12" textClickEnabled="false" color="0x484848" marginBottom="20" markerType="bubble"> filters> DropShadowFilterblurX="1" blurY="1" angle="45" alpha="0.6" distance="2" quality="1" strength="0.6"/> filters> AmLegend> BorderContainer> Application> 此例子的完整包


- 配套讲稿:
如PPT文件的首页显示word图标,表示该PPT已包含配套word讲稿。双击word图标可打开word文档。
- 特殊限制:
部分文档作品中含有的国旗、国徽等图片,仅作为作品整体效果示例展示,禁止商用。设计者仅对作品中独创性部分享有著作权。
- 关 键 词:
- flex3D 柱状图
 冰豆网所有资源均是用户自行上传分享,仅供网友学习交流,未经上传用户书面授权,请勿作他用。
 《贝的故事》教案4.docx
-
《对韵歌》优秀教案8.docx
-
《函数yAsinωx+φ+P图象》wwwnet.docx
-
《静夜思》教学设计.docx
-
《汽车底盘构造与维修》题库与考核标准.docx
-
《世说新语》复习资料.docx
-
《我的服装我做主》教案设计.docx
-
《在品味情感中成长》教学片断设计.docx
-
11造价员《建设工程造价管理基础知识》精讲教程文件.docx
-
《不会叫的狗》教案 人教部编版1.docx
-
《操作系统》二学期A卷及答案.docx
-
《傅雷家书》名著阅读笔记.docx
-
《反不正当竞争法》下互联网平台封禁行为考辨以消费者用户合法权益保护为中心.docx
-
《化工原理》第六章蒸发.docx
-
《蓝海战略》概要11页.docx
-
《人生》读书心得.docx
-
《荷叶圆圆》公开课教案优秀教学设计26.docx
-
《科技出行研究报告》智能网联与新能源将变革未来汽车出行.docx
-
《272 向量的应用举例》导学案1.docx
-
《秋天》评课稿.docx
-
《电算化》第二章会计电算化的工作环境章节练习.docx
-
《室外给排水管道》施组.docx
-
《广东省建筑与装饰工程综合定额》计算规则.docx
-
《我多想去看看》教学.docx
-
《直通车车手基础认证》 考试答案 70题之欧阳育创编.docx
-
7天销量翻10倍皇冠卖家教您玩转最精准流量.docx
-
9 阿长和山海经.docx
-
《比例尺》教案.docx
-
《菜根谭》注译四闲适篇.docx
-
《福尔摩斯探案集》读后感15篇.docx
-
《红对勾》古代诗歌选择题答案补充.docx
-
《课堂密码》读后感及心得精选多篇.docx
-
部编版二年级语文下册期中知识点汇总.docx
-
部编版语文五年级下册6 景阳冈 课课练含答案新教材.docx
-
百份中考试题汇编说明文阅读.docx
-
采矿学资料.docx
-
部编六年级语文上18知识点与同步练习.docx
-
版《浙江电信无线增值业务合作协议》.docx
-
操作手册PP010物料清单主数据.docx
-
部分常用有机物缩写.docx
-
版高中地理第一章人口的变化第二节人口的空间变化学案新人教版必修2.docx
-
叉车考试题.docx
-
超完整版论文港口物流对珠三角经济贸易发展的影响分析.docx
-
仓库管理工作年终总结.docx
-
成人高考政治模拟试题及答案解析.docx
-
版英语全能大一轮复习外研版阅读强化练二.docx
-
产品推广协议书.docx
-
初三化学 化学推断题的专项 培优 易错 难题练习题及详细答案.docx
-
车载设备安装流程.docx
-
常用集成电路引脚图.docx
-
帮助孩子度过入学关一年级.docx
