 完整版投资学第10版课后习题答案Chap007Word文件下载.docx
- 文档编号:20439438
- 上传时间:2023-01-23
- 格式:DOCX
- 页数:15
- 大小:204.34KB
完整版投资学第10版课后习题答案Chap007Word文件下载.docx
《完整版投资学第10版课后习题答案Chap007Word文件下载.docx》由会员分享,可在线阅读,更多相关《完整版投资学第10版课后习题答案Chap007Word文件下载.docx(15页珍藏版)》请在冰豆网上搜索。
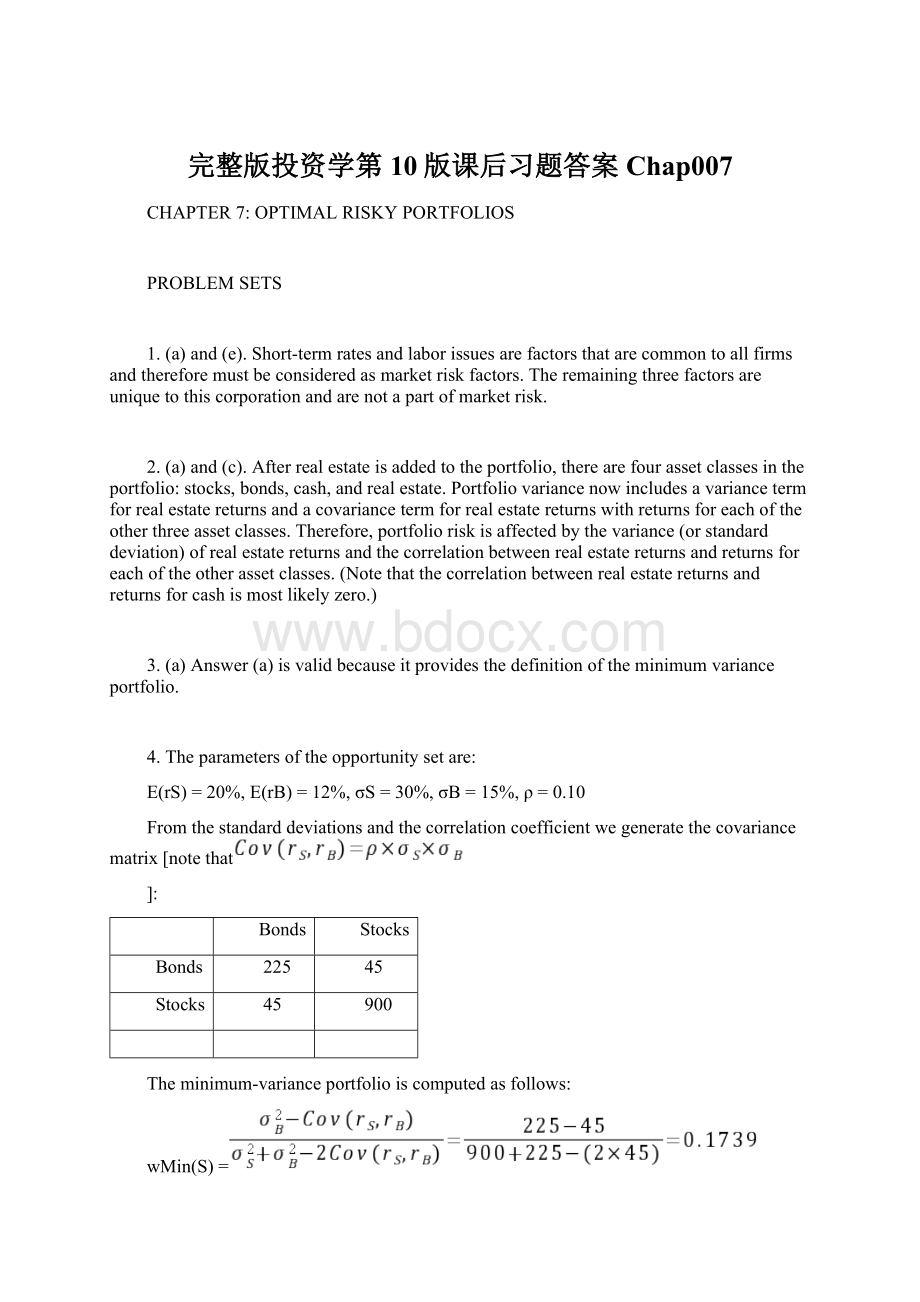
E(rMin)=(0.1739×
.20)+(0.8261×
.12)=.1339=13.39%
σMin=
=[(0.17392900)+(0.82612225)+(20.17390.826145)]1/2
=13.92%
5.
Proportion
inStockFund
inBondFund
Expected
Return
Standard
Deviation
0.00%
100.00%
12.00%
15.00%
17.39
82.61
13.39
13.92
minimumvariance
20.00
80.00
13.60
13.94
40.00
60.00
15.20
15.70
45.16
54.84
15.61
16.54
tangencyportfolio
16.80
19.53
18.40
24.48
100.00
0.00
20.00
30.00
Graphshownbelow.
6.Theabovegraphindicatesthattheoptimalportfolioisthetangencyportfoliowithexpectedreturnapproximately15.6%andstandarddeviationapproximately16.5%.
7.Theproportionoftheoptimalriskyportfolioinvestedinthestockfundisgivenby:
Themeanandstandarddeviationoftheoptimalriskyportfolioare:
E(rP)=(0.4516×
.20)+(0.5484×
.12)=.1561
=15.61%
σp=[(0.45162900)+(0.54842225)+(20.45160.5484×
45)]1/2
=16.54%
8.Thereward-to-volatilityratiooftheoptimalCALis:
9.a.Ifyourequirethatyourportfolioyieldanexpectedreturnof14%,thenyoucanfindthecorrespondingstandarddeviationfromtheoptimalCAL.TheequationforthisCALis:
IfE(rC)isequalto14%,thenthestandarddeviationoftheportfoliois13.04%.
b.TofindtheproportioninvestedintheT-billfund,rememberthatthemeanofthecompleteportfolio(i.e.,14%)isanaverageoftheT-billrateandtheoptimalcombinationofstocksandbonds(P).LetybetheproportioninvestedintheportfolioP.ThemeanofanyportfolioalongtheoptimalCALis:
SettingE(rC)=14%wefind:
y=0.7884and(1−y)=0.2119(theproportioninvestedintheT-billfund).
Tofindtheproportionsinvestedineachofthefunds,multiply0.7884timestherespectiveproportionsofstocksandbondsintheoptimalriskyportfolio:
Proportionofstocksincompleteportfolio=0.78840.4516=0.3560
Proportionofbondsincompleteportfolio=0.78840.5484=0.4323
10.Usingonlythestockandbondfundstoachieveaportfolioexpectedreturnof14%,wemustfindtheappropriateproportioninthestockfund(wS)andtheappropriateproportioninthebondfund(wB=1−wS)asfollows:
0.14=0.20×
wS+0.12×
(1−wS)=0.12+0.08×
wSwS=0.25
Sotheproportionsare25%investedinthestockfundand75%inthebondfund.Thestandarddeviationofthisportfoliowillbe:
σP=[(0.252900)+(0.752225)+(20.250.7545)]1/2=14.13%
Thisisconsiderablygreaterthanthestandarddeviationof13.04%achievedusingT-billsandtheoptimalportfolio.
11.a.
Eventhoughitseemsthatgoldisdominatedbystocks,goldmightstillbeanattractiveassettoholdasapartofaportfolio.Ifthecorrelationbetweengoldandstocksissufficientlylow,goldwillbeheldasacomponentinaportfolio,specifically,theoptimaltangencyportfolio.
b.
Ifthecorrelationbetweengoldandstocksequals+1,thennoonewouldholdgold.TheoptimalCALwouldbecomposedofbillsandstocksonly.Sincethesetofrisk/returncombinationsofstocksandgoldwouldplotasastraightlinewithanegativeslope(seethefollowinggraph),thesecombinationswouldbedominatedbythestockportfolio.Ofcourse,thissituationcouldnotpersist.Ifnoonedesiredgold,itspricewouldfallanditsexpectedrateofreturnwouldincreaseuntilitbecamesufficientlyattractivetoincludeinaportfolio.
12.SinceStockAandStockBareperfectlynegativelycorrelated,arisk-freeportfoliocanbecreatedandtherateofreturnforthisportfolio,inequilibrium,willbetherisk-freerate.Tofindtheproportionsofthisportfolio[withtheproportionwAinvestedinStockAandwB=(1–wA)investedinStockB],setthestandarddeviationequaltozero.Withperfectnegativecorrelation,theportfoliostandarddeviationis:
σP=Absolutevalue[wAσAwBσB]
0=5×
wA−[10(1–wA)]wA=0.6667
Theexpectedrateofreturnforthisrisk-freeportfoliois:
E(r)=(0.6667×
10)+(0.3333×
15)=11.667%
Therefore,therisk-freerateis:
11.667%
13.False.Iftheborrowingandlendingratesarenotidentical,then,dependingonthetastesoftheindividuals(thatis,theshapeoftheirindifferencecurves),borrowersandlenderscouldhavedifferentoptimalriskyportfolios.
14.False.Theportfoliostandarddeviationequalstheweightedaverageofthecomponent-assetstandarddeviationsonlyinthespecialcasethatallassetsareperfectlypositivelycorrelated.Otherwise,astheformulaforportfoliostandarddeviationshows,theportfoliostandarddeviationislessthantheweightedaverageofthecomponent-assetstandarddeviations.Theportfoliovarianceisaweightedsumoftheelementsinthecovariancematrix,withtheproductsoftheportfolioproportionsasweights.
15.Theprobabilitydistributionis:
Probability
RateofReturn
0.7
100%
0.3
−50
Mean=[0.7×
100%]+[0.3×
(-50%)]=55%
Variance=[0.7×
(100−55)2]+[0.3×
(-50−55)2]=4725
Standarddeviation=47251/2=68.74%
16.σP=30=y×
σ=40×
yy=0.75
E(rP)=12+0.75(30−12)=25.5%
17.Thecorrectchoiceis(c).Intuitively,wenotethatsinceallstockshavethesameexpectedrateofreturnandstandarddeviation,wechoosethestockthatwillresultinlowestrisk.ThisisthestockthathasthelowestcorrelationwithStockA.
Moreformally,wenotethatwhenallstockshavethesameexpectedrateofreturn,theoptimalportfolioforanyrisk-averseinvestoristheglobalminimumvarianceportfolio(G).WhentheportfolioisrestrictedtoStockAandoneadditionalstock,theobjectiveistofindGforanypairthatincludesStockA,andthenselectthecombinationwiththelowestvariance.Withtwostocks,IandJ,theformulafortheweightsinGis:
Sinceallstandarddeviationsareequalto20%:
Thisintuitiveresultisanimplicationofapropertyofanyefficientfrontier,namely,thatthecovariancesoftheglobalminimumvarianceportfoliowithallotherassetsonthefrontierareidenticalandequaltoitsownvariance.(Otherwise,additionaldiversificationwouldfurtherreducethevariance.)Inthiscase,thestandarddeviationofG(I,J)reducesto:
ThisleadstotheintuitiveresultthatthedesiredadditionwouldbethestockwiththelowestcorrelationwithStockA,whichisStockD.TheoptimalportfolioisequallyinvestedinStockAandStockD,andthestandarddeviationis17.03%.
18.No,theanswertoProblem17wouldnotchange,atleastaslongasinvestorsarenotrisklovers.Riskneutralinvestorswouldnotcarewhichportfoliotheyheldsinceallportfolioshaveanexpectedreturnof8%.
19.Yes,theanswerstoProblems17and18wouldchange.Theefficientfrontierofriskyassetsishorizontalat8%,sotheoptimalCALrunsfromtherisk-freeratethroughG.Thisimpliesrisk-averseinvestorswilljustholdTreasurybills.
20.Rearrangethetable(convertingrowstocolumns)andcomputeserialcorrelationresultsinthefollowingtable:
NominalRates
Small
Company
Large
Long-Term
Government
Intermed-TermGovernment
Treasury
Bills
Inflation
1920s
-3.72
18.36
3.98
3.77
3.56
-1.00
1930s
7.28
-1.25
4.60
3.91
0.30
-2.04
1940s
20.63
9.11
3.59
1.70
0.37
5.36
1950s
19.01
19.41
0.25
1.11
1.87
2.22
1960s
13.72
7.84
1.14
3.41
3.89
2.52
1970s
8.75
5.90
6.63
6.11
6.29
7.36
1980s
12.46
17.60
11.50
12.01
9.00
5.10
1990s
13.84
18.20
8.60
7.74
5.02
2.93
SerialCorrelation
0.46
-0.22
0.60
0.59
0.63
0.23
Forexample:
tocomputeserialcorrelationindecadenominalreturnsforlarge-companystocks,wesetupthefollowingtwocolumnsinanExcelspreadsheet.Then,usetheExcelfunction“CORREL”tocalculatethecorrelationforthedata.
Decade
Previous
-1.25%
18.36%
9.11%
19.41%
7.84%
5.90%
17.60%
18.20%
Notethateachcorrelationisbasedononlysevenobservations,sowecannotarriveatanystatisticallysignificantconclusions.Lookingattheresults,however,itap


- 配套讲稿:
如PPT文件的首页显示word图标,表示该PPT已包含配套word讲稿。双击word图标可打开word文档。
- 特殊限制:
部分文档作品中含有的国旗、国徽等图片,仅作为作品整体效果示例展示,禁止商用。设计者仅对作品中独创性部分享有著作权。
- 关 键 词:
- 完整版 投资 10 课后 习题 答案 Chap007
 冰豆网所有资源均是用户自行上传分享,仅供网友学习交流,未经上传用户书面授权,请勿作他用。
 对中国城市家庭的教育投资行为的理论和实证研究.docx
-
二年级下册数学练习题大全.docx
-
二十年后回故乡的优秀作文.docx
-
软基换填施工方案.docx
-
《黑白装饰画》教案.docx
-
课堂教学改革实施方案5篇.docx
-
返璞归真简约致美解读《给予树》教学设计语文.docx
-
离职证明范本精选多篇.docx
-
《天局》全文.docx
-
我害怕作文集合15篇.docx
-
伏魔战记39详细攻略.docx
-
幼儿园学期计划.docx
-
雅思分类打印版Word格式文档下载.docx
-
年产1万吨竹子纤维加工项目可行性研究报告文档格式.docx
-
电商产业化项目投资经营商业计划书Word文件下载.docx
-
医学多媒体课件的设计与制作Word文档格式.docx
-
中学生中秋节想象作文Word格式.docx
-
等保20之漏洞扫描系统技术方案建议书Word文档格式.docx
-
培训学校个人工作计划模板5篇Word格式.docx
-
北京各区二模试题分类汇编文言文阅读Word文档下载推荐.docx
-
不同职业病危害因素的防护常识Word格式文档下载.docx
-
一年级上册同音形近字练习汇总Word文档格式.docx
-
班级家长会上班主任教师讲话稿Word下载.docx
-
科斯塔环载波恢复Word文件下载.docx
-
浙教义务版六年级语文下册教案 花潮Word文件下载.docx
-
集成电路设计与集成系统专业Word格式文档下载.docx
-
开工第一课专题讲座观后感文档格式.docx
-
东城区学年第一学期高三期末化学试题及答案Word格式文档下载.docx
-
苏教版六年级语文下册第七单元测试题Word格式文档下载.docx
-
学长征精神做红色传人活动方案文档格式.docx
-
读书笔记150字30篇文档格式.docx
-
中级经济法考前必背法条精华版备考资料Word格式.docx
-
许鞍华中国新现实主义电影的自觉继承者.docx
-
土地分等定级复习重点.docx
-
网上授课心得体会5篇.docx
-
学术英语课后答案unit1.docx
-
十年驾车经验总结.docx
-
事业单位个人工作总结.docx
-
我国婚姻法中的夫妻财产关系.docx
-
水塔水位的PLC控制.docx
-
四川省拟任县处级党政领导职务政治理论水平任职资格考试试题1.docx
-
物态变化整章复习教案和提高习题.docx
-
人教版小学数学二年级上学期教学工作总结.docx
-
睡前故事哄女朋友长篇8篇.docx
-
食用香料香精产品生产许可实施细则.docx
-
系统总体设计原则信息化项目.docx
-
软件测试计划TMPSTP汇编.docx
-
系统集成项目管理工程师考试大纲0330190711.docx
-
司法考试 民法篇 选择题.docx
-
上海市初中科学总复习.docx
-
苏教版数学一年级下册第六单元100以内的加法和减法二教案.docx
