 雅思写作小作文范文柱状图文档格式.docx
- 文档编号:19588898
- 上传时间:2023-01-08
- 格式:DOCX
- 页数:13
- 大小:83.89KB
雅思写作小作文范文柱状图文档格式.docx
《雅思写作小作文范文柱状图文档格式.docx》由会员分享,可在线阅读,更多相关《雅思写作小作文范文柱状图文档格式.docx(13页珍藏版)》请在冰豆网上搜索。
第一段
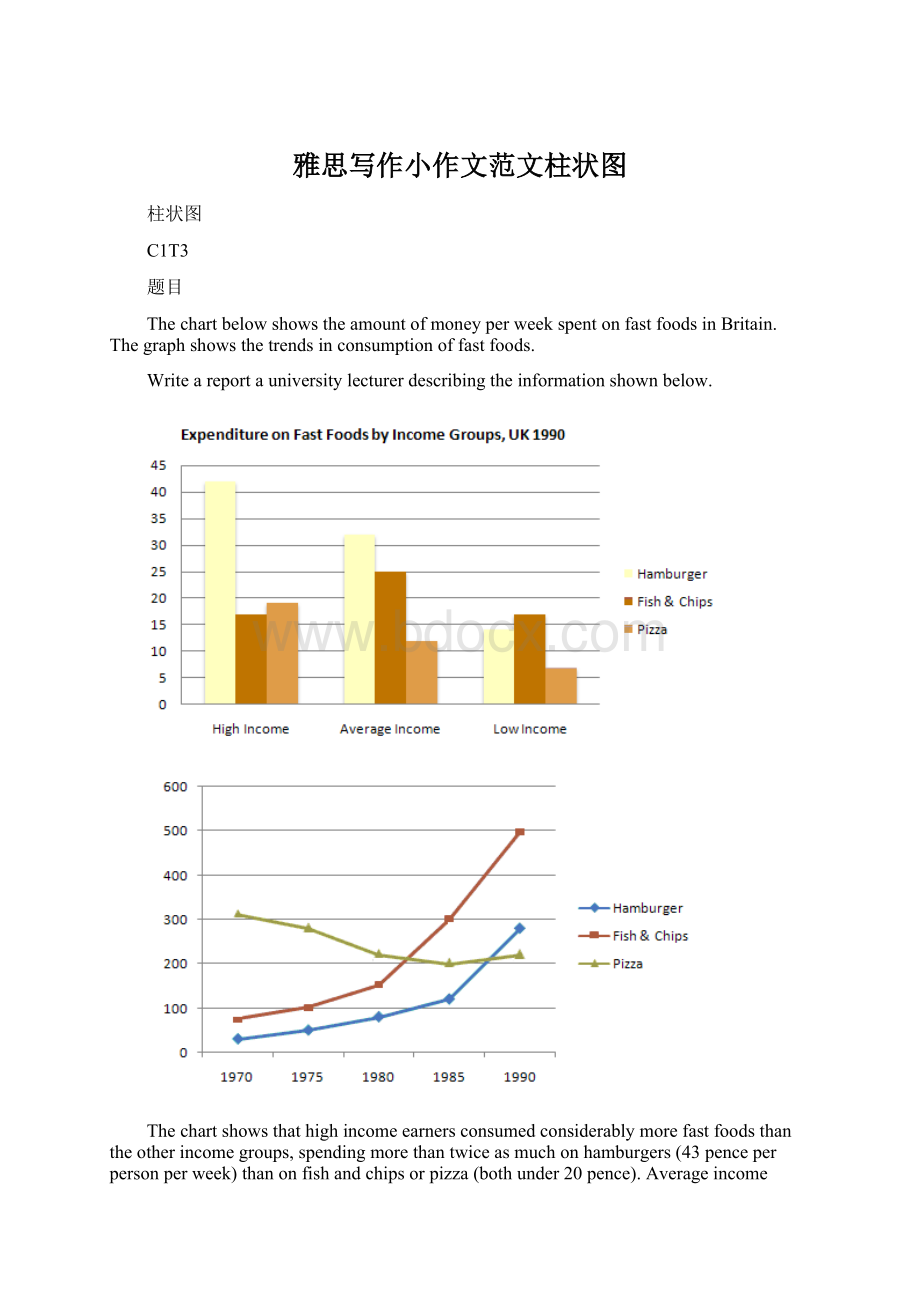
Thechartshowsthathighincomeearnersconsumedconsiderablymorefastfoodsthantheotherincomegroups,spendingmorethantwiceasmuchonhamburgers(43penceperpersonperweek)thanonfishandchipsorpizza(bothunder20pence).
•说明了高收入人群的两个特点,第一是消耗快餐最多,第二是人群中hamburger,fishandchips,pizza的特点
•spendingmorethantwiceasmuchonhamburgersthanonfishandchipandchipsorpizza这是一句令人费解的句子,含义应为“消耗的汉堡是薯片或匹萨的两倍多”,应用的句型应当为典型的表示倍数关系的句型“ntimesas…as”,比如
✓Thisairplanefliestwotimesasfastasthatone.这家飞机的飞行速度是那架的两倍。
✓Hehasfivetimesasmanybooksasyou.他拥有的书是你的五倍。
•所以,这句话应当为spendingmorethantwiceasmuchonhamburgerasonfishandchipsorpizza,其中morethan修饰twice,表示比较句型为twiceasmuch…as
•表示倍数比较的句型中还有一个重要的ntimesmorethan,也表示“是几倍”,而非多几倍,比如
✓Chinais22timeslargerthanBritain.中国是英国的22倍。
•fishandchips表示的一组东西“油煎鱼价炸土豆片”,表示的是个不可数的概念
Averageincomeearnersalsofavoredhamburgers,spending33penceperpersonperweek,followedbyfishandchipsat24pence,thenpizzaat11pence.
•说明了中收入人群的三类食品的消耗情况。
•这句是典型的表示顺序关系的表达,hamburgers,followedbyfishandchips,thenpizza,其表达句型为A,followedbyB,thenC,这种表达尤其在饼图中应用尤为广泛
Lowincomeearnersappeartospendlessthanotherincomegroupsonfastfoods,thoughfishandchipsremainstheirmostpopularfastfood,followedbyhamburgersandthenpizza.
•说明了低收入人群的两个特征,第一是该人群消耗的快餐数量最少,通过though这个从句说明了第二个特征,那就是该人群消耗三类食品的情形。
•结合上句,来看看如何表达“最喜欢”,Averageincomeearnersfavoredhamburgers;
Fishandchipsremainstheirmostpopularfastfood.
第二段
Fromthegraphwecanseethatin1970,fishandchipsweretwiceaspopularasburgers,pizzabeingatthattimetheleastpopularfastfood.
•说明三类食品的起点(1970)情况,
•Ntimesas…as句型说明了fishandchips和burgers的关系
•pizzabeingtheleastpopularfastfoodatthattime为“独立主格结构”
Theconsumptionofhamburgersandpizzahasrisensteadilyoverthe20yearperiodto1990whiletheconsumptionoffishandchipshasbeenindeclineoverthatsameperiodwithaslightincreaseinpopularitysince1985.
•用一个表示对照的连词while说明上升趋势的hamburgers和下降趋势的fishandchips
注意上升和下降的表达
✓上升hasrisensteadily
✓下降hasbeenindecline
•表示段时间overthe20yearperiodto1990,overthesameperiod
•withaslightincreaseinpopularity用with从句补充说明大趋势下的小变化
词汇句型积累
重点和难点是表示倍数关系的比较句型
•Ntimesas+形容词或副词原级…as
•Ntimes+形容词或副词的比较级…than
这两者均表示“是几倍”,并非“多出几倍”,特别注意,很多参考书都写错了
表示三种的顺序关系A,followedbyB,thenC,这个表达在饼图中很常用
表示变化趋势
•表示上升rise,beinincrease
•表示下降beindecline,drop
八分作文
柱状图显示的是1970-1990二十年间英国人每周在快餐上花费了多少钱;
曲线图展示的是这二十年间快餐消费的趋势。
ThebarchartshowshowmuchmoneywasspentonfastfoodsperweekintheUKoveraspanof20yearsfrom1970to1990whilethegraphrevealsthetrendoffastfoodconsumptionoverthesameperiodoftime.
从柱状图看,各收入阶层在汉堡和鱼煎薯条这两种快餐上的支出相对高于在皮萨上的消费;
曲线图反映出汉堡与皮萨的消费呈现上升趋势,鱼煎薯条则呈现出波动趋势。
Aswecanseefromthechart,theweeklyexpensesofpeopleofdifferentincomelevelsonhamburgersandfishandchipswererelativelyhigherthanthatonpizza.Thegraphindicatesthatwhilehamburgerandpizzaconsumptionbothrevealedageneraltrendofincrease,fishandchipsshowedatrendoffluctuation.
首先,高收入阶层和中等收入阶层每周在汉堡上的平均消费分别是每人42便士和33便士,比低收入阶层的14便士搞出了很多。
在鱼煎薯条方面,高收入阶层的支出略低,是17便士,但中等及低收入阶层的支出都分别达到了25便士和18便士,相对于在皮萨方面支出的12便士和8便士高出了很多。
值得一提的是高收入阶层在皮萨上的消费高于鱼煎薯条2便士,为20便士。
First,theweeklyaverageexpensesofhigh-incomepeopleandmiddle-incomepeoplewere42penceand33pencerespectively,alothigherthanthatoflow-incomepeoplewhichwas14pence.Asforfishandchips,high-incomepeoplespentrelativelyless,only17pence,buttheexpensesofmiddle-incomeandlow-incomegroupsreached25penceand18pence,muchhigherthantheirexpensesonpizzawhichstoodat12penceand8pencerespectively.Whatisworthmentioningistheamountofmoneyspentonpizzabyhigh-incomepeoplewhichshowedonly20pence,2pencemorethantheirexpenseonfishandchips.
第二,从1970年的每周平均85克开始,人们在汉堡上的消费缓步增长到了1975年的100克,然后,消费量加大增速,到1983年左右已经达到了200多克。
接下来,我们看到的是更强势的增长,到1990年达到了图表上的最高峰550克。
Second,startingfromaveragely85gramsperweekin1970,people’sconsumptionofhamburgersgraduallygrewto100gramsin1975andwasthenfollowedbyafastergrowth,reachingmorethan200gramsinaround1983.Fromthenon,thegrowthgainedastrongermomentum,hittingthepeakacrosstheboardat550gramsin1990.
第三,皮萨的消费趋势与汉堡相仿,也是很明显的三个增长阶段,但是增幅没有汉堡那么大。
1970年至1980年,皮萨的消费从平均每周40克慢慢增长到80克;
1980年至1985年,增长加快,从80克增加到了130克;
1985年至1990年,增幅加大,从130克快速增长到了280克。
Third,theconsumptionofpizzarevealedasimilartrendofgrowthasthatofhamburgersandcouldalsobeclearlycutintothreeperiods,thoughthegrowthratewasnotthatfast.Itroseslowlyfrom40gramsperweekin1970to80gramsin1980andthengrewfasterfrom80gramsin1980to130gramsin1985.From1985,thegrowthratewasevenfasterandweseeabigincreasefrom130gramsto280grams.
第四,鱼煎薯条的消费趋势在波动中呈现了三种状态。
1970年至1975年一直是缓慢的下降,从平均每周300克降至280克;
之后,从1975年至1985年,下降速度稍有加快,从280克降至200克;
自此,开始逐渐回升,到1990年攀升到了240克。
Fourth,theconsumptionoffishandchipsshowedthreechangesinthegeneraltrendoffluctuation.From1970to1975,itdroppedslowlyfromtheoriginal300gramsperweekin1970to280gramsin1975.Lateron,from1975to1985,itdroppedalittlebitfasterwhenitfellfrom280gramsto200grams.Fromthenon,itbegantorisegraduallyandtill1990,ithadclimbedbackto240grams.
总之,英国人在上述所提及的三种快餐方面的消费在图表所标识的二十年里都发生了或增或降的某些变化。
Tosumup,theconsumptionofthethreeabovementionedfastfoodsinBritainshowedcertainrisesandfallsasillustratedinthechartandgraphoverthedesignated20years.
C2T2
Thechartbelowshowstheamountofleisuretimeenjoyedbymenandwomenofdifferentemploymentstatus.
Writeareportforauniversitylecturerdescribingtheinformationshownbelow.
Thechartshowsthenumberofhoursenjoyedbymenandwomeninatypicalweekin1998–9,accordingtogenderandemploymentstatus.
Amongthoseemployedfull-time,menonaveragehadfiftyhoursofleisure,whereaswomenhadapproximatelythirty-sevenhours.Therewerenofiguresgivenformalepart-timeworkers,butfemalepart-timershadfortyhoursofleisuretime,onlyslightlymorethanwomeninfull-timeemployment,perhapsreflectingtheirworkinthehome.
Intheunemployedandretiredcategories,leisuretimeshowedanincreaseforbothsexes,asmighthavebeenexpected.Heretoo,menenjoyedmoreleisuretime–overeighthours,comparedwithseventyhoursforwomen,perhapsonceagainreflectingthefactthatwomenspendmoretimeworkinginthehomethanmen.
Lastly,housewivesenjoyedapproximatelyfifty-fourhoursofleisure,onaverage.Therewerenofiguresgivenforhousehusbands!
Overall,thechartdemonstratesthatinthecategoriesforwhichstatisticsonmaleleisuretimewereavailable,menenjoyedatleasttenhoursofextraleisuretime.
•简单的题目,但是把文章的三个指标都给谈到了,时间theamountofleisuretime,性别bymenandwomen,工作种类ofdifferentemploymentstatus
•典型的通过改写题目,提示图表的内容
•看作者是如何谈论三个指标的,时间thenumberofhours,性别menandwomen,工作种类accordingtogender
andemploymentstatus(再次谈到了性别),另外补充说明了图形标题的一点内容inatypicalweekin1998–9.
Amongthoseemployedfull-time,menonaveragehadfiftyhoursofleisure,whereaswomenhadapproximatelythirty-sevenhours.
•用一个whereas连词,对比说明了men和women的时间情形,
•工作组别信息:
amongthoseemployedfull-time
•性别信息:
men,women
•时间信息:
hadfiftyhoursofleisure,hadthirty-sevenhours
•表示平均onaverage,表示大约approximately
Therewerenofiguresgivenformalepart-timeworkers,butfemalepart-timershadfortyhoursofleisuretime,onlyslightlymorethanwomeninfull-timeemployment,perhapsreflectingtheirworkinthehome.
•这句话说明了两点内容,第一是part-timeworkers的情况,第二是与full-timeemployment作了比较
•工作组别和性别信息:
formalepart-timeworkers,femalepart-timers
Therewerenofiguresgiven(表示缺失值),hadfortyhoursofleisuretime
•比较part-time和full-time妇女的休息时间(Femalepart-timershad)onlyslightlymorethanwomeninfull-time
•employment,注意短语的逻辑主语,还有必须注意part-time和full-time妇女的不同表示法
•适度的评价,perhapsreflectingtheirworkinthehome,这句其逻辑主语为前面那句onlyslightmorethanwomen
•infull-timeemployment,这句话的含义是“虽然为part-timefemales,但是相应的承担了更多的家务,所以休息时间只
•是比full-timefemales多那么一点点”
•很多同学争


- 配套讲稿:
如PPT文件的首页显示word图标,表示该PPT已包含配套word讲稿。双击word图标可打开word文档。
- 特殊限制:
部分文档作品中含有的国旗、国徽等图片,仅作为作品整体效果示例展示,禁止商用。设计者仅对作品中独创性部分享有著作权。
- 关 键 词:
- 雅思 写作 作文 范文 柱状图
 冰豆网所有资源均是用户自行上传分享,仅供网友学习交流,未经上传用户书面授权,请勿作他用。
 对中国城市家庭的教育投资行为的理论和实证研究.docx
-
二年级下册数学练习题大全.docx
-
二十年后回故乡的优秀作文.docx
-
软基换填施工方案.docx
-
《黑白装饰画》教案.docx
-
课堂教学改革实施方案5篇.docx
-
返璞归真简约致美解读《给予树》教学设计语文.docx
-
离职证明范本精选多篇.docx
-
《天局》全文.docx
-
我害怕作文集合15篇.docx
-
伏魔战记39详细攻略.docx
-
幼儿园学期计划.docx
-
雅思分类打印版Word格式文档下载.docx
-
年产1万吨竹子纤维加工项目可行性研究报告文档格式.docx
-
电商产业化项目投资经营商业计划书Word文件下载.docx
-
医学多媒体课件的设计与制作Word文档格式.docx
-
中学生中秋节想象作文Word格式.docx
-
等保20之漏洞扫描系统技术方案建议书Word文档格式.docx
-
培训学校个人工作计划模板5篇Word格式.docx
-
北京各区二模试题分类汇编文言文阅读Word文档下载推荐.docx
-
不同职业病危害因素的防护常识Word格式文档下载.docx
-
一年级上册同音形近字练习汇总Word文档格式.docx
-
班级家长会上班主任教师讲话稿Word下载.docx
-
科斯塔环载波恢复Word文件下载.docx
-
浙教义务版六年级语文下册教案 花潮Word文件下载.docx
-
集成电路设计与集成系统专业Word格式文档下载.docx
-
开工第一课专题讲座观后感文档格式.docx
-
东城区学年第一学期高三期末化学试题及答案Word格式文档下载.docx
-
苏教版六年级语文下册第七单元测试题Word格式文档下载.docx
-
学长征精神做红色传人活动方案文档格式.docx
-
读书笔记150字30篇文档格式.docx
-
中级经济法考前必背法条精华版备考资料Word格式.docx
-
土木工程材料.docx
-
作业改错评语.docx
-
幼儿园家庭游戏活动方案.docx
-
小学16年级数学概念理解+详细说明.docx
-
网络安全的概念.docx
-
医学影像设备.docx
-
专利申请书3篇.docx
-
装饰装修工程成品保护方案.docx
-
英语作文专项训练docx.docx
-
推荐K12学习届高考语文一轮复习第一章语言文字的运用专题八日常应用文微写作含语言得体等要求核.docx
-
英语论文The Application of the Situational Language Teaching.docx
-
幼儿园小班上学期语言教案.docx
-
网约车驾驶员从业资格考试区域科目考试题库新.docx
-
医院医务人员职业暴露防护工作制度.docx
-
小学二年级体育教案上学期.docx
-
淄博房地产买卖合同范本.docx
-
专业实习报告合集九篇.docx
-
应力和应变关系.docx
-
幼儿园中班语言教案高高山上条藤四篇.docx
