 R语言季节性arima模型案例附代码数据文档格式.docx
- 文档编号:18890673
- 上传时间:2023-01-02
- 格式:DOCX
- 页数:6
- 大小:52.54KB
R语言季节性arima模型案例附代码数据文档格式.docx
《R语言季节性arima模型案例附代码数据文档格式.docx》由会员分享,可在线阅读,更多相关《R语言季节性arima模型案例附代码数据文档格式.docx(6页珍藏版)》请在冰豆网上搜索。
head(data)
##sales
##1105715
##2120136
##3181669
##4239813
##5159980
##6164760
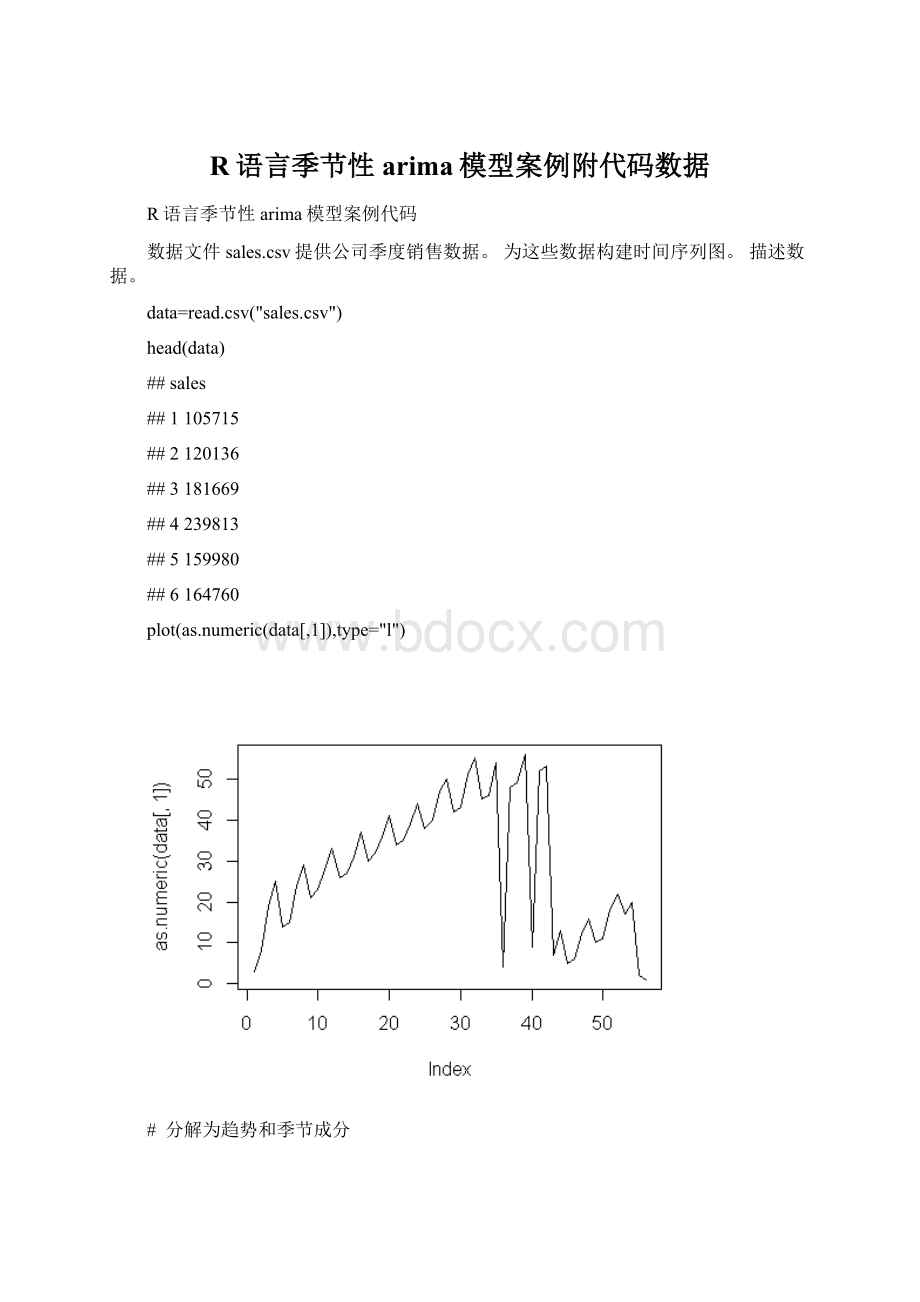
plot(as.numeric(data[,1]),type="
l"
#分解为趋势和季节成分
#从数据来看,有明显得波动趋势,因此可能存在季节性趋势,需要进行季节性差分。
#计算趋势(使用适当的移动平均线)和季节性成分。
将时间趋势,季节性因素和剩余序列与时间对应,并对您的地块进行评论。
kingstimeseries<
-ts(as.numeric(data[,1]),frequency=12)
kingstimeseries
##JanFebMarAprMayJunJulAugSepOctNovDec
##13819251415242921232833
##2262731373032364134353944
##338404750424351554546544
##448495695253713561216
##510111822172021
kingstimeseriescomponents<
-decompose(kingstimeseries)
kingstimeseriescomponents$seasonal#gettheestimatedvaluesoftheseasonalcomponent
##JanFebMarAprMayJun
##1-1.16493060.60590287.7934028-4.41493065.37673617.1684028
##2-1.16493060.60590287.7934028-4.41493065.37673617.1684028
##3-1.16493060.60590287.7934028-4.41493065.37673617.1684028
##4-1.16493060.60590287.7934028-4.41493065.37673617.1684028
##5-1.16493060.60590287.7934028-4.41493065.37673617.1684028
##JulAugSepOctNovDec
##1-2.17534722.7204861-5.5503472-4.25868061.4913194-7.5920139
##2-2.17534722.7204861-5.5503472-4.25868061.4913194-7.5920139
##3-2.17534722.7204861-5.5503472-4.25868061.4913194-7.5920139
##4-2.17534722.7204861-5.5503472-4.25868061.4913194-7.5920139
##5-2.17534722.7204861
plot(kingstimeseriescomponents)
#从差分图来看,数据有明显得季节趋势,需要进行季节性差分。
#预测销售量,使用这种方法计算预测值,并绘制一个图中观察到的时间序列和预测值。
library(forecast)
mm<
-auto.arima(kingstimeseries)
plot(kingstimeseries)
lines(mm$fitted,col="
red"
#从图中看,拟合程度一般,拟合曲线在实际数据周围。
#绘制观测时间序列和剩余序列的自相关函数。
将它们放在同一页面上(但在两个不同的面板上)。
par(mfrow=c(2,1))
acf(kingstimeseries)
acf(mm$residuals)
#从残差来看,落入置信区间,因此模型拟合良好。
#Thedatafiletsdata.txtcontainstheobserveddataonatimeseries.
#Makeatimeseriesplotthesampleautocorrelationfunctionforthisdata.
#Putthesetwoplotsonthesamepage(butontwopanels).Isthislikelytobeastationaryprocess?
Doesthislooksimilartoawhitenoise?
Explain.
data=read.table("
tsdata.txt"
header=T)
##x
##152.4361
##254.6242
##355.1351
##454.1483
##553.3472
##653.8972
acf(data[,1])
#从图中我们发现数据没有落入置信区间,因此不是平稳数据
#(b)(5points)Makeatimeseriesplotofthedifferencedseriesofthistimeseriesdata.
#Alsoconstructthesampleautocorrelationfunctionofthedifferencedseries.Put
#thesetwoplotsonthesamepage(butontwopanels).Isthedifferencedserieslikely
#tobeastationaryprocess?
plot(diff(as.numeric(data[,1])),type="
acf((diff(as.numeric(data[,1]))))
#从图上我们发现差分后的数据落入置信区间,因此事平稳数据


- 配套讲稿:
如PPT文件的首页显示word图标,表示该PPT已包含配套word讲稿。双击word图标可打开word文档。
- 特殊限制:
部分文档作品中含有的国旗、国徽等图片,仅作为作品整体效果示例展示,禁止商用。设计者仅对作品中独创性部分享有著作权。
- 关 键 词:
- 语言 季节性 arima 模型 案例 代码 数据
 冰豆网所有资源均是用户自行上传分享,仅供网友学习交流,未经上传用户书面授权,请勿作他用。
 铝散热器项目年度预算报告.docx
-
牛津上海版通用小学英语三年级上册Unit 12同步练习2II 卷.docx
-
论我国私营企业员工激励机制.docx
-
人教版五年级品德与社会上册全册教案.docx
-
开学啦国旗下讲话稿三分钟.docx
-
露天采矿学复习题.docx
-
六年级英语教师年度考核个人总结.docx
-
某路站综合体项PC吊装施工方案.docx
-
人教版九年级历史上册期末考试试题一套.docx
-
隆昌妇幼保健院.docx
-
芦二矿抽采达标中长期规划.docx
-
看拼音写词语.docx
-
模拟磁盘调度算法系统的设计毕业设计.docx
-
每周一条名言警句或一首诗词.docx
-
棉花膜下滴灌示范工程设计总结报告.docx
-
九年级化学教案第十单元酸和碱教案新人教版.docx
-
宁波市水资源公报.docx
-
农业实用技术培训工作意见与农业局上半年工作总结范例两篇汇编.docx
-
平行线的判定.docx
-
内部会计管理制度11成本核算制度.docx
-
盘扣式脚手架支撑方案.docx
-
旅游规划模板.docx
-
煤矿大本大专毕业设计大采高综采工作面作业规程.docx
-
美学选择题整理课件资料.docx
-
名家论腹泻慢性肠炎.docx
-
宁夏银川市第一中学学年高一上学期期中考试地理试题解析解析版.docx
-
年产吨精密纤维纸项目建设建议书.docx
-
农技推广中心工作总结.docx
-
彭宇案的法逻辑批判.docx
-
宁夏仕奇房产网发布份房地产交易情况.docx
-
项目推荐书智能温控节能系统.docx
-
区县节日期间加强消防安全讲话稿与区发改委领导班子述职述廉报告汇编.docx
-
标准药品代理合同样书正式版.docx
-
高考英语一轮复习 Unit 5 Art and Culture同步导学 重大版必修3.docx
-
宾馆20XX年工作总结新整理.docx
-
财务报表分析西南大学作业答案.docx
-
高考英语专练阅读填空原卷版 1.docx
-
高三英语词语解析复习教案doc.docx
-
部编版四年级下册语文每课复习点梳理.docx
-
高校毕业生自我鉴定.docx
-
部编版小学三年级语文上册6 秋天的雨 教学设计含课堂作业及答案精编.docx
-
福建省环保局危险废物经营许可证申请书教学提纲.docx
-
高一下学期期末考试英语试题含答案.docx
-
部编人教版四年级语文下学期期末知识点整理复习及答案.docx
-
甘肃省定西市九年级上学期第一次月考语文试题.docx
-
高速公路加宽的施工技术.docx
-
财务情况说明书范文3篇.docx
-
干部绩效考核办法.docx
-
部编版七年级上册语文《期中考试试题》含答案解析.docx
-
钢结构玻璃遮雨棚施工方案精编版.docx
-
产品加工制作合同协议书.docx
