 Multiple Linear Regression Model1Word格式.docx
- 文档编号:16471000
- 上传时间:2022-11-23
- 格式:DOCX
- 页数:12
- 大小:134.77KB
Multiple Linear Regression Model1Word格式.docx
《Multiple Linear Regression Model1Word格式.docx》由会员分享,可在线阅读,更多相关《Multiple Linear Regression Model1Word格式.docx(12页珍藏版)》请在冰豆网上搜索。
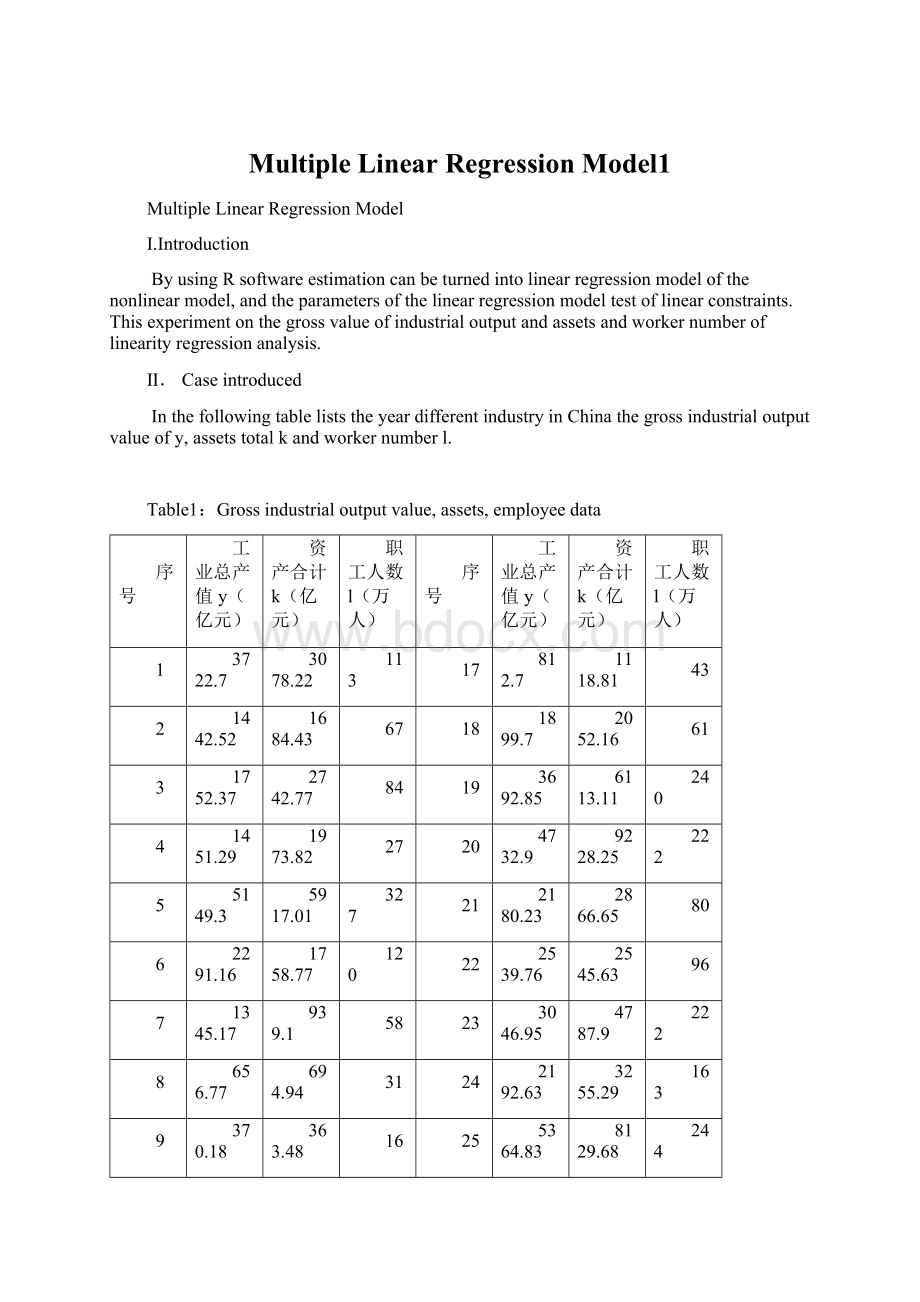
240
4
1451.29
1973.82
27
20
4732.9
9228.25
222
5
5149.3
5917.01
327
21
2180.23
2866.65
80
6
2291.16
1758.77
120
22
2539.76
2545.63
96
7
1345.17
939.1
58
23
3046.95
4787.9
8
656.77
694.94
31
24
2192.63
3255.29
163
9
370.18
363.48
16
25
5364.83
8129.68
244
10
1590.36
2511.99
66
26
4834.68
5260.2
145
11
616.71
973.73
7549.58
7518.79
138
12
617.94
516.01
28
867.91
984.52
46
13
4429.19
3785.91
29
4611.39
18626.94
218
14
5749.02
8688.03
254
30
170.3
610.91
15
1781.37
2798.9
83
325.53
1523.19
45
1243.07
1808.44
33
Ⅲ.ModelBuilding
3.1.Model_1Setamodelfor
Step1:
Readthedata
>
da=read.table("
C:
/23/f.csv"
sep="
"
)
y=da[,2]
k=da[,3]
l=da[,4]
win.graph(width=3.5,height=3.5,pointsize=8)
plot(y,k)#plotthescatterofyandk
plot(y,l)#plotthescatterofyandl
Step2:
PARAMETERESTIMATION
m1=lm(y~k+l)
summary(m1)
Call:
lm(formula=y~k+l)
Residuals:
Min1QMedian3QMax
-2113.0-472.9-232.7196.53928.2
Coefficients:
EstimateStd.ErrortvaluePr(>
|t|)
(Intercept)588.61734339.389361.7340.09386.
k0.199260.081942.4320.02167*
l11.120213.622673.0700.00473**
---
Signif.codes:
0‘***’0.001‘**’0.01‘*’0.05‘.’0.1‘’1
Residualstandarderror:
1143on28degreesoffreedom
MultipleR-squared:
0.6715,AdjustedR-squared:
0.648
F-statistic:
28.62on2and28DF,p-value:
1.706e-07
Itisconcludedthatthefollowingregressionequation:
Analysisofvariance
anova(m1)
AnalysisofVarianceTable
Response:
y
DfSumSqMeanSqFvaluePr(>
F)
k1624666966246669647.80771.624e-07***
l112311730123117309.42250.004725**
Residuals28365854951306625
Residualanalysis
re1=residuals(m1)
plot(re1)
Step3:
Resultsanalysis
1.coefficientofdetermination
BecauseofR^2=0.6715,sothefittingeffectisnotgood
2.TESTSOFHYPOTHESES
Agivenlevelofsignificance:
qf(0.975,2,27)
[1]4.242094
qt(0.975,27)
[1]2.051831
F=28.62>
F(2,27)=4.24
P=1.706e-07<
0.05,Showthatk,lcombinedtohaveasignificantlinearimpactony.
T(k)=2.432〉t(27)=2.05;
T(l)=3.070〉t(27)=2.05,Showthatk,lofyhassignificantlinearinfluence.
3.Accordingtotheresidualfigure,wecanfindthatasthedatasequence,residualobviousdeviationfromthemean,theincreasescope,showedthatpoorregressionresults.
4.Theregressionequationresidualanalysis
plot(m1)
Fromtheaboveknowable,deviatingfromthefittinglinesituationisrelativelyserious,canalsobeconcludedthatthefittingeffectisnotgood.
3.2.Model2
Setamodelfor
Thelogarithmictransformation,
Canbeconvertedinto
Step1:
DATAPROCESSING
y1=log(y)#takelogarithms
k1=log(k)
l1=log(l)
Table2:
data(ln)
Serialnumber
Grossvalueofindustrialoutput
lnY
Assetstotal
lnK
Theworkernumber
lnL
(亿元)
(万人)
8.222204
8.032107
4.727388
7.274147
7.429183
4.204693
7.468724
7.916724
4.430817
7.280208
7.587726
3.295837
8.546616
8.685587
5.78996
7.736814
7.47237
4.787492
7.204276
6.844922
4.060443
6.487334
6.543826
3.433987
5.913989
5.895724
2.772589
7.371716
7.828831
4.189655
6.424399
6.881134
6.426391
6.246126
3.332205
8.395972
8.239042
4.110874
8.656785
9.069701
5.537334
7.485138
7.936982
4.418841
7.125339
7.50022
3.496508
6.700362
7.020021
3.7612
7.549451
7.626648
8.214154
8.718191
5.480639
8.462293
9.130025
5.402677
7.687186
7.960899
4.382027
7.839825
7.842133
4.564348
8.021896
8.473847
7.692857
8.088037
5.09375
8.58762
9.003277
5.497168
8.48357
8.567924
4.976734
8.929247
8.92516
4.927254
6.766088
6.892154
3.828641
8.436285
9.832364
5.384495
5.137562
6.41495
2.944439
5.785455
7.328562
3.806662
Parameterestimation
m2=lm(log(y)~log(k)+log(l))
summary(m2)
lm(formula=log(y)~log(k)+log(l))
-1.20679-0.155170.031790.265320.73927
(Intercept)1.15400.72761.5860.12397
log(k)0.60920.17643.4540.00178**
log(l)0.36080.20161.7900.08432.
0.4255on28degreesoffreedom
0.8099,AdjustedR-squared:
0.7963
59.66on2and28DF,p-value:
8.035e-11
(exp(1.1540)=3.170851)
anova(m2)
log(y)
log(k)121.024921.0249116.10691.805e-11***
log(l)10.58000.58003.20320.08432.
Residuals285.07030.1811
Residualanalysis
re2=residuals(m2)
plot(re2)
2.coefficientofdetermination
:
BecauseofR^2=0.8099,Sothefittingeffectisbetterthanmodel1.
3.TESTSOFHYPOTHESES
Agivenlevelofsignificanceis5%,
F=59.66>
P=8.035e-11<
0.05,ShowthatLNK,LNLcombinedtohaveasignificantlinearimpactonlny
。
T(lnk)=3.454>
2.05,T(lnl)=1.790<
2.05,LNKparametersthroughthetestofsignificanceofvariables;
ButtheparametersoftheLNLfailedtheinspection.
Ifagiven10%significancelevel
qt(0.95,27)
[1]1.703288
1.70;
T(lnl)=1.790>
1.70,SotheLNK,LNLparametersthroughthetestofsignificanceofvariables.
3.Accordingtotheresidualfigure,wecanfindthatinadditiontothethreeabnormalpointsafter,evenlydistributedaroundthezeroresidual,andvolatility,within0.5regressionresultisgood.
4.Theregressionequationresidualfigure
plot(m2)


- 配套讲稿:
如PPT文件的首页显示word图标,表示该PPT已包含配套word讲稿。双击word图标可打开word文档。
- 特殊限制:
部分文档作品中含有的国旗、国徽等图片,仅作为作品整体效果示例展示,禁止商用。设计者仅对作品中独创性部分享有著作权。
- 关 键 词:
- Multiple Linear Regression Model1
 冰豆网所有资源均是用户自行上传分享,仅供网友学习交流,未经上传用户书面授权,请勿作他用。
 如何打造酒店企业文化2刘田江doc.docx
-
律师提供著作权法律服务业务操作指引.docx
-
18秋福建师范大学《经济法》在线作业一.docx
-
施工现场危险源.docx
-
山东省潍坊市昌乐县学年七年级地理下学期期中学业质量评估试题.docx
-
新视野大学英语视听说教程第二版第一册完整答案.docx
-
精校版重庆市 初中毕业水平暨高中招生考试中考英语试题AB卷Word版含答案解析.docx
-
新视野大学英语视听说教程第二版第一册完整答案.docx
-
江苏省刘国钧中学1112学年高二语文上学期期末考前辅导试题卷苏教版会员独享.docx
-
山东省潍坊市昌乐县学年七年级地理下学期期中学业质量评估试题.docx
-
西安交通大学18年课程考试《管理会计》作业考核试题.docx
-
施工安全保证体系.docx
-
南开17秋学期《科学启蒙尔雅》在线作业2.docx
-
秋福师《大学英语1》在线作业二.docx
-
231695 北交《运输物流管理》在线作业2 15秋答案.docx
-
梁原学区安全管理工作实施方案.docx
-
环保管理台帐明细.docx
-
我国三大翻译证书考试概览.docx
-
东大17秋学期《大学英语二》在线作业31.docx
-
静态分析指标.docx
-
山东金瀚控股金瀚置业绩效考核指标库.docx
-
B0301A国际贸易.docx
-
人教版八年级数学上册同步练习试题及答案第11章《三角形》 同步练习及答案111.docx
-
秋福师《概率论》在线作业二.docx
-
17秋福师《高级英语阅读二》在线作业一.docx
-
西南大学17秋0764《工程建设监理》在线作业参考资料.docx
-
生活宝典之社会大转盘一.docx
-
专卖店管理.docx
-
100个CFO的八年之资金管理篇.docx
-
东北师范古代汉语三16秋在线作业2.docx
-
专业技术人员公共危机管理考试.docx
-
东大17秋学期《大学英语二》在线作业31.docx
-
工作总结之幼儿园读书活动总结Word格式文档下载.docx
-
教育叙事范文Word格式.docx
-
广西钦州市钦州港区学年高三理科综合上学期份考试试题 Word版含答案Word文档格式.docx
-
股权转让流程Word下载.docx
-
路桥中学重点班入学英语试题及答案Word下载.docx
-
岗位适应性理论题库选择题Word下载.docx
-
焊接基本知识学习材料收藏板文档格式.docx
-
弘扬传统文化作文18篇完整版Word下载.docx
-
节能减排工作总结20篇文档格式.docx
-
公路工程施工总结文档格式.docx
-
河北衡水中学全国高三大联考全国卷理科综合化学试题 Word版含答案Word文件下载.docx
-
关汉卿与元杂剧中的包公戏讲解Word文件下载.docx
-
黑龙江省大兴安岭地区届九年级物理仿真第一次备考试题文档格式.docx
-
贵广铁路隧道防排水施工作业指导书Word文档下载推荐.docx
-
宏程序基础理论文档格式.docx
-
项目管理人员岗位职责Word文档下载推荐.docx
-
轮机动力设备操作评估试题答案解析海事局考试必备Word下载.docx
-
公务员考试练习资料分析题模拟题324Word文件下载.docx
-
高二年段中国古代文化常识知识竞赛文档格式.docx
